1
PsaC | PSI positive control/quantitation standard
AS04 042S | Recombinant protein standard for quantitation, for use in Western blot.
- Product Info
-
Format: Lyophilized in glycerol. Quantity: 100 µl Reconstitution: For reconstitution add 95 µl of sterile water. Note that due to glycerol in buffer, the lyophilized product appears as a dense liquid rather than a powder. Allow the product several minutes to solubilize after adding water. Mix thoroughly but gently. Avoid vigorous vortexing, as buffer contains detergent. Upon reconstitution, this standard is ready-to-load and does not require any additions or heating. See additional Handling Instructions below.
PsaC standard protein concentration: 0.10 pmol/µl.Storage: Store lyophilized/reconstituted at -20°C; once reconstituted make aliquots to avoid repeated freeze-thaw cycles. Please remember to spin the tubes briefly prior to opening them to avoid any losses that might occur from material adhering to the cap or sides of the tube. Tested applications: Western blot (WB) Recommended dilution: Positive control: a 2 μL load per well is optimal for most chemiluminescent detection systems.
Standard curve: 3 loads are recommended (eg. 0.5, 2 and 4 μL). For most applications a sample load of 0.2 μg of chlorophyll will give a PsaC signal in this range. Exact loads can vary with the sensitivity of your system and the abundance of the target protein in your samples.
Note: Optimal quantitation is achieved using moderate sample loads/well, generally 1 to 5 ug total protein.
A trial experiment may be required
i) to bring your sample load within the standard curve range and
ii) to obtain a signal that is strong enough to reliably quantify but not so strong as to consume ECL reagents too quickly or saturate your detection system. These goals may achieved by adjusting both sample and standard loads.Expected | apparent MW: 11.5 kDa (larger than native protein due to the addition of His-tag), In most gels PsaC migrates between 9 and 14 kDa - Application Examples
-
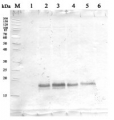
Application example
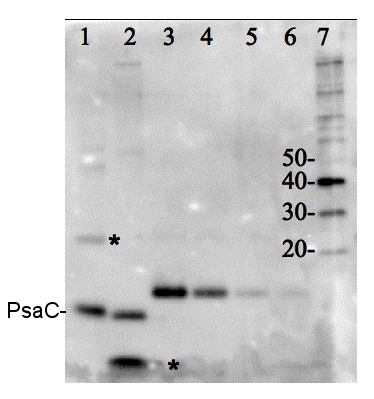
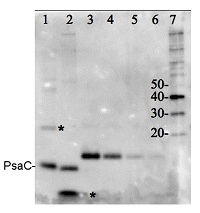
Total protein from Trichodesmium sp. (1) and Thalassiosira sp. (2). Recombinant PsaC protein standard (AS04 042S) (3-6) loaded at 0.5 pmoles, 0.3 0.1 and 0.05 pmoles. Molecular weight markers (MagicMark XP, Invitrogen) (7). Samples were separated on 4-12% NuPage (Invitrogen) LDS-PAGE and blotted 1h to PVDF. Blots were blocked immediately following transfer in 2% blocking reagent in 20 mM Tris, 137 mM sodium chloride pH 7.6 with 0.1% (v/v) Tween-20 (TBS-T) for 1h at room temperature with agitation. Blots were incubated in the primary antibody at a dilution of 1: 50 000 for 1h at room temperature with agitation. The antibody solution was decanted and the blot was rinsed briefly twice, then washed once for 15 min and 3 times for 5 min in TBS-T at room temperature with agitation. Blots were incubated in secondary antibody (anti-hen IgY horse radish peroxidase conjugated) diluted to 1:50 000 in 2% blocking solution for 1h at room temperature with agitation. The blots were washed as above and developed for 5 min with chemiluminescence detection reagent according the manufacturers instructions. Images of the blots were obtained using a CCD imager (FluorSMax, Bio-Rad) and Quantity One software (Bio-Rad).
Note: Optimal quantitation is achieved using moderate sample loads per gel lane, generally 0.5 to 2.5 ug total protein, depending on the abundance of the target protein.Quantitation: When quantitated standards are included on the blot, the samples can be quantitated using the available software. Excellent quantitation can be obtained with images captured on the Bio-Rad Fluor-S-Max or equivalent instrument using Bio-Rad QuantityOne software. The contour tool is used to select the area for quantitation and the values are background subtracted to give an adjusted volume in counts for each standard and sample. Using above protocol linear standard curves are generated over 1-1.5 orders of magnitude range in target load. It is important to note that immunodetections usually show a strongly sigmoidal signal to load response curve, with a region of trace detection of low loads, a pseudolinear range and a region of saturated response with high loads. For immunoquantitation it is critical that the target proteins in the samples and the standard curve fall within the pseudolinear range. Our total detection range using this protocol spans over 2 orders of magnitude, but the quantifiable range is narrower.
Quantitative western blot: detailed method description.
- Additional Information
-
Additional information: Handling Instructions
*IMPORTANT: In our experience, viscous liquids are surprisingly stable; insufficient mixing is the most common reason for unsatisfactory results. Following mixing, briefly pulse in a microcentrifuge to collect material from cap.
Standard needs to be fully thawed and thoroughly mixed before each use. Proteins tend to stratify with the more dense layer after freezing. We recommend bringing the product to room temperature and either mixing by inverting or flicking tube 5-10 times. Pipetting up and down may also provide sufficient mixing, provided the tip is moved within the tube while taking up and expelling the liquid.Additional information (application): Protein standard buffer composition: Protein standard buffer composition: Glycerol 10%, Tris Base 141 mM, Tris HCl 106 mM, LDS 2%, EDTA 0.51 mM, SERVA® Blue G250 0.22 mM, Phenol Red 0.175 mM, pH 8.5, 0.1mg/ml PefaBloc protease inhibitor (Roche), 50mM DTT.
- Background
-
Background: PsaC is a conserved, chloroplast-encoded, Fe-S binding protein of approximately 10kDa, present in all known Photosystem I complexes. It is located on the stromal side of the thylacoid membranes. PsaC coordinates the Fe–S clusters FA and FB through two cysteine-rich domains.This product is a recombinant protein standard, source: Synechocystis PCC 6803.
The PsaC protein standard can be used in combination with global anti-PsaC antibodies to quantitate PsaC from a wide range of species. Global antibodies are raised against highly conserved amino acid sequences in the PsaC protein.
Quantitative western blot: detailed method description, video tutorial - Product Citations
-
Selected references: Rogowski et al. (2021) Light as a substrate: migration of LHCII antennas in extended Michaelis-Menten model for PSI kinetics. J Photochem Photobiol B. 2021 Dec;225:112336. doi: 10.1016/j.jphotobiol.2021.112336. Epub 2021 Oct 19. PMID: 34736069.
Pipitone et al. (2021). A multifaceted analysis reveals two distinct phases of chloroplast biogenesis during de-etiolation in Arabidopsis. Elife. 2021 Feb 25;10:e62709. doi: 10.7554/eLife.62709. PMID: 33629953; PMCID: PMC7906606.
Rogowski et al. (2021) Light as a substrate: migration of LHCII antennas in extended Michaelis-Menten model for PSI kinetics. J Photochem Photobiol B. 2021 Dec;225:112336. doi: 10.1016/j.jphotobiol.2021.112336. Epub 2021 Oct 19. PMID: 34736069.
Levitan et al. (2019). Structural and functional analyses of photosystem II in the marine diatom Phaeodactylum tricornutum. Proc Natl Acad Sci U S A. 2019 Aug 27;116(35):17316-17322. doi: 10.1073/pnas.1906726116.
Li et al. (2016). A Hard Day's Night: Diatoms Continue Recycling Photosystem II in the Dark. Front. Mar. Sci., 08 November 2016 | http://dx.doi.org/10.3389/fmars.2016.00218
Vandenhecke et al. (2015). Changes in the Rubisco to photosystem ratio dominates photoacclimation across phytoplankton taxa. Photosynth Res. 2015 Apr 11.
Wu et al. (2014). Large centric diatoms allocate more cellular nitrogen to photosynthesis to counter slower RUBISCO turnover rates. Front. Mar. Sci., 09 December 2014 | doi: 10.3389/fmars.2014.00068.
Li et al. (2014). The nitrogen costs of photosynthesis in a diatom under current and future pCO2. New Phytol. 2014 Sep 25. doi: 10.1111/nph.13037. - Protocols
-
Agrisera Western Blot protocol and video tutorials
Quantitative Immunoblotting in Plant Sciences using Global Antibodies
Amanda Cockshutt1 & Joanna Porankiewicz-Asplund2
1.Environmental Proteomics NB Inc. Sackville NB CANADA,
2.Agrisera AB, Vännäs, SWEDEN,Summary:
Detecting and quantitating important proteins in plants and other photosynthetic organisms has become more practical and powerful with the application of quantitative immunoblotting using global antibodies which recognize proteins evenly across a wide range of taxa. While many tools are commercially available for the examination of medically relevant proteins in mammals, such tools have been lacking for the study of pressing questions in other organisms. Here we present the advantages of quantitative immunoblotting and the methodology necessary to apply these tools.Introduction | The exquisite specificity of the antibody antigen interaction has long been exploited by protein biochemists. Antibodies bind to small regions on proteins, termed epitopes, which often consist of only a few amino acids. This binding is highly specific
and of high affinity. As each antibody recognizes only a small part of the whole protein, an immunogenic peptide can be selected using sequence alignments. This short peptide is highly conserved and exclusive to the protein under study. The resulting antibodies are then immunoreactive with the conserved peptide region within intact proteins derived from a number of species. We refer to these as Global Antibodies, and they provide both scientific and practical advantages. In non-medical areas such as plant sciences, comparative analyses across species, is often productive; Global Antibodies permit such cross-taxon studies with level detection efficiencies across wide taxonomic ranges. From a practical standpoint, a Global Antibody functioning across a wide taxonomic range reduces the cost of antibody production and stocking by creating a detection tool useful in a wide range of studies.
The ELISA, or Enzyme Linked ImmunoSorbent Assay, employs specific antibodies in a high through put application for the measurement of specific substances in samples of diverse origins. While some sample and antibody combinations can be optimized for detections using ELISA, others are less successful. This can be the result of antibodies with significant cross reactivities, samples that do not adhere optimally to the plate, a lack of quantitated standards or samples of variable quality that display differential reactivity in ELISA. A similar approach is the quantitative immunoblot. As such, it uses the same principles as the ELISA, a reliance on the highly specific antibody antigen interaction to measure the amount of a given protein in a complex mixture. The
major distinguishing feature of this method is the inclusion of a step to electrophoretically separate the proteins in the sample according to their molecular weights. Thus, all samples can be solubilized using a standardized procedure and analyzed concurrently for a number of interesting proteins. The separation step allows the researcher to be more confident that the signal generated actually results from the target protein in question because it is spatially resolved from cross-reactions which would confound an ELISA system.Limitations of Traditional Techniques | A number of traditional techniques are available for the measurement of different functions or complexes of photosynthetic organisms. These include an array of enzyme and functional assays. A disadvantage of such approaches is that they require individually specialized sample harvesting and preparation techniques, and often specialized equipment or reagents for each assay. Therefore a single sample preparation cannot be used to quantify different protein complexes. Furthermore, many samples are not available in the quantities or preservation states necessary for multiple determinations of different protein complexes.
Advantages of Immunodetections with Global Antibodies | When Global Antibodies are used for quantitative immunodetections even small, mixed samples from various harvesting procedures can be assessed for multiple complexes simultaneously. Since all detections employ a common solubilization protocol as a starting point, comparisons between complexes can be made with greater confidence. Since Global Antibodies recognize short highly conserved regions of the protein targets they can be applied to a very broad range of target organisms. They can also be applied with considerable confidence to uncharacterized or mixed samples.
Quantitated recombinant protein standards have been generated to be used as a calibration with Global Antibodies. The target peptide antigen is perfectly conserved in these standard proteins, thus they can be applied for comparative quantitation of the target protein from all species.
Standards and antibodies available
Photosystem I Anti-PsaC (AS04 042) | standard: recombinant PsaC(AS04 042S)
Photosystem II Anti-PsbA C-terminal (AS01 016, AS05 084) | Anti-PsbA N-terminal | (AS06 124) | standard: recombinant PsbA (AS01 016S) | Anti-PsbB (AS04 038) | Anti-PsbD (AS06 146) |
ATP Synthase Anti-AtpB (AS03 030, AS05 085) | standard: recombinant AtpB (AS03 030S) |
RuBisCO Anti-RbcL RbcL (AS01 017, AS03 037)| standard: Rubisco protein (AS03 017S)
Nitrogen Metabolism: Anti-GlnA (AS01 018) | standard: recombinant GlnA (AS01 018S) |
Anti-NifH (AS01 021A) | standard: recombinant NifH (AS01 021S)
Methodology | Sample Preparation. Plant samples are generally ground with liquid nitrogen in a mortar and pestle. The resulting powder is transferred to a plastic tube. Algal samples can be either concentrated by centrifugation or, preferably, by filtration onto glass fiber filters.
Solubilization is performed in Agrisera extraction buffer PEB (AS08 300) , 0.1mg/mL PefaBloc SC (AEBSF) protease inhibitor (Roche). Disruption is most optimally obtained through flash freezing of the sample in liquid nitrogen alternated with thawing by sonication with a microtip. This process can be repeated depending on the toughness of the sample. The sample is adjusted to 50 mM dithiothreitol and heated to 70°C for 5 minutes. Samples are cooled and centrifuged briefly prior to electrophoresis. Optimal quantitation is achieved using moderate sample loads per gel lane, generally 0.5 to 2.5 ug total protein, depending on the abundance of the target protein.
Electrophoresis and Immunoblotting: Once solubilized, the proteins can be separated electrophoretically in a number of systems. We obtain optimal results with the Invitrogen NuPAGE gel system using Bis-Tris 4-12% gradient gels. Proteins are separated in MES SDS running buffer according to the manufacturer’s recommendations at 200 V for 35 minutes. The gels are transferred to PVDF in the same apparatus, the SureLock XCell blot module, for 60 minutes at 30 V for a single gel or 80 minutes for a pair. Following transfer the blots are blocked in 2% blocking agent in tris buffered saline with 0.1% Tween 20 (TBS-T) for 1 hour at room temperature with gentle agitation. The blot is incubated with primary antibody, usually at 1:25 000 to 1:50 000 diluted in 2% blocking agent, for 1 hour at room temperature. For quantitation a relatively high primary antibody:target protein ratio gives more reliable results than immunoblots at low ratios of primary antibody:target protein.
The blot is washed extensively in TBS-T (twice briefly, once for 15 minutes and three times for five minutes). The blot is incubated with secondary antibody, for example goat anti-rabbit IgG horse radish peroxidase conjugated, at 1:50,000 in 2% blocking agent, for 1h/RT with agitation. The blot is washed as above and developed with chemiluminescence detection reagent in mid picogram or extreme femtogram range.Quantitation | When quantitated standards are included on the blot, the samples can be quantitated using the available software. We obtain excellent quantitation with images captured on the Bio-Rad Fluor-S-Max or equivalent instrument using Bio-Rad QuantityOne software. The contour tool is used to select the area for quantitation and the values are background subtracted to give an adjusted volume in counts for each standard and sample. Using this protocol allows us to generate linear standard curves over 1-1.5 orders of magnitude range in target load. It is important to note that immunodetections usually show a strongly sigmoidal signal to load response curve, with a region of trace detection of low loads, a pseudolinear range and a region of saturated response with high loads. For immunoquantitation it is critical that the target proteins in the samples and the standard curve fall within the pseudolinear range. Our total detection range using this protocol spans over 2 orders of magnitude, but the quantifiable range is narrower.
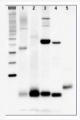
Example | Undergraduate students performed a light shift experiment on two cyanobacterial strains, Synechococcus elongatus PCC 7942 and Anabaena sp. PCC 7120. The students prepared 4 samples for each species and loaded 0.1 ug chlorophyll per lane. Standard lanes of PsbA (D1) protein contained 0.05 pmoles , 0.15 pmoles and 0.45 pmoles. The blots were processed as described above with the chicken anti-PsbA antibody used at 1:20,000 and rabbit anti-chicken IgY-HRP secondary antibodies at 1:50,000. The resulting blot is shown in Figure 1.
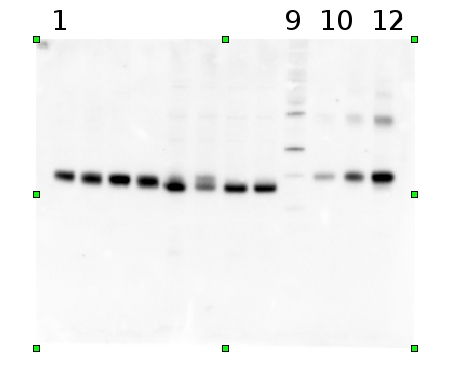
Figure 1: An example immunoblot of samples of Synechococcus elongatus PCC 7942 (lanes 1-4) and Anabaena sp. PCC 7120 (lanes 5-8). Molecular weight markers (MagicMark XP, Invitrogen) are in lane 9. Recombinant PsbA protein standards are loaded in lanes 10-12 at 0.05 pmoles, 0.15 pmoles and 0.45 pmoles.
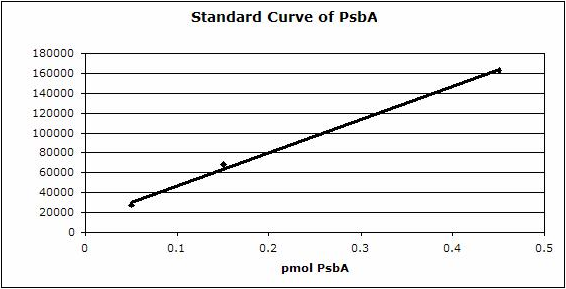
Figure 2: Standard curve for the blot in Figure 1. Picomoles of quantitated standard is plotted on the X-axis versus the adjusted signal volume obtained on the Y-axis.
Conclusion | Quantitative immunoblotting is a powerful but simple tool for the measurement of protein complexes from photosynthetic and other organisms. This technique can be applied to a wide range of species with excellent results, because Global Antibodies raised against conserved peptides can be shared across research on different species and research areas like: ecophysiology, microbial ecology, molecular physiology, proteomics and oceanography.
References | Bouchard J, Suzanne Roy S, Campbell DA (2006) Ultraviolet-B Effects on the Photosystem II-D1 Protein of Phytoplankton Species and Natural Phytoplankton Communities Photochemistry and Photobiology, 82: 936-951
Campbell DA, Cockshutt AM, Porankiewicz-Asplund J (2003) Analyzing Photosynthetic Complexes in Uncharacterized Species or Mixed Phytoplankton Communities using Global Antibodies. Physiologia Plantarum 119: 322-327
MacKenzie TDB, Johnson JM, Cockshutt AM, Burns RA, Campbell DA (2005) Large reallocations of carbon, nitrogen and photosynthetic reductant among phycobilisomes, photosystems and Rubisco during light acclimation in Synechococcus elongatus are constrained in cells under low environmental inorganic carbon. Archives of Microbiology, 183: 190 - 202
Recommended secondary antibodies: goat anti-rabbit HRP conjugated, goat anti-rabbit ALP conjugated
Recommended chemiluminescent detection reagent: AgriseraECLBright
Agrisera Western Blot protocol and video tutorialsQuestions? You are welcome to contact us.
- Reviews:
-
This product doesn't have any reviews.
Related products
AS09 602 | Clonality: Polyclonal | Host: Goat | Reactivity: Rabbit IgG (H&L)
AS09 607 | Clonality: Polyclonal Host: Goat Reactivity: Rabbit IgG (H&L)
AS10 939 | Clonality: Polyclonal | Host: Rabbit | Reactivity: [global antibody] for higher plants, algae, cyanobacteria, diatoms
Benefits of using this antibody