1
HTA9 | Probable histone H2A variant 3
AS10 718 | Clonality: Polyclonal | Host: Rabbit | Reactivity: Arabidopsis thaliana
- Product Info
-
Immunogen: KLH-conjugated synthetic peptide derived from Arabidopsis thaliana HTA9 UniProt: Q9C944, TAIR: At1g52740
Host: Rabbit Clonality: Polyclonal Purity: Immunogen affinity purified serum in PBS pH 7.4. Format: Lyophilized Quantity: 50 �g Reconstitution: For reconstitution add 50 µl of sterile water Storage: Store lyophilized/reconstituted at -20�C; once reconstituted make aliquots to avoid repeated freeze-thaw cycles. Please remember to spin the tubes briefly prior to opening them to avoid any losses that might occur from material adhering to the cap or sides of the tube. Tested applications: Chromatin Immunoprecipitation (ChIP), Immunoprecipitation (IP), Western blot (WB) Recommended dilution: 6 µg (ChIP), 1: 100 (IP), 1 : 1000 (WB) Expected | apparent MW: 14.2 kDa (Arabidopsis thaliana)
- Reactivity
-
Confirmed reactivity: Arabidopsis thaliana Not reactive in: Nicotiana tabacum - Application Examples
-
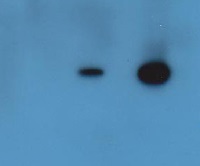
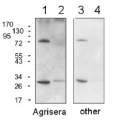
Application example 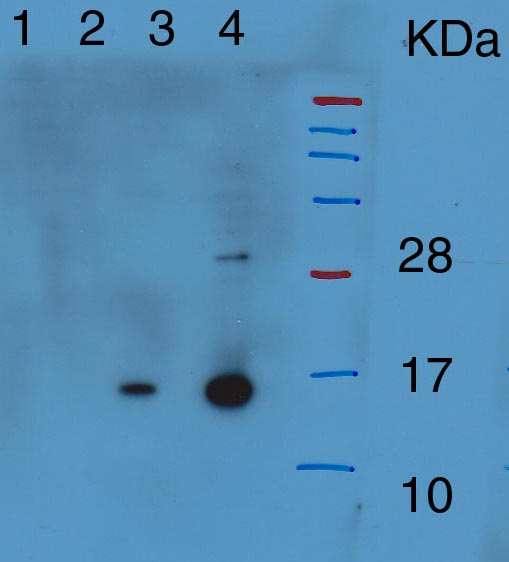
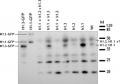
1) hta9, hta11 double mutant, about 1 ug protein; 2) mutant hta9, hta11 about 2 ug protein; 3) wild-type about 2-3 ug protein; 4) wild-type about 4-5 ug protein from Arabidopsis thaliana.
Protein from Arabidopsis histone preparation (acid extracted, precipitated with acetone and resuspended in urea). Denatured with SDS-PAGE buffer at 90C for 2 min, separated on 15% SDS-PAGE and blotted 1h to PVDF tank transfer. Blots were blocked with PBS + 3% BSA overnight at 4C with agitation. Blot was incubated in the primary antibody at a dilution of 1:1 000 in PBS + 3% BSA for 1h at RT with agitation. The antibody solution was decanted and the blot was rinsed once with PBS-T for 5 min. Blot was incubated in secondary antibody PBS + 3% BSA (anti-rabbit IgG horse radish peroxidase conjugated, from Agrisera, AS09 602) diluted to 1:25 000 for 1h at RT with agitation. The blot was washed 3-4 times with PBS-T for 5 min. The blot was developed with Immobilion (Millipore) and exposed on an X-ray film for 1 min.Application examples: 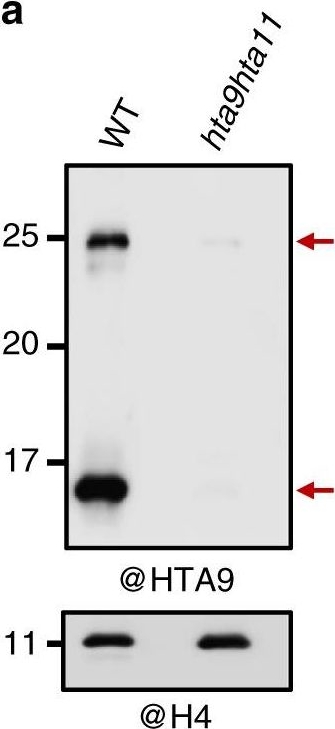
Reactant: Arabidopsis thaliana (Thale cress)
Application: Western Blotting
Pudmed ID: 31249301
Journal: Nat Commun
Figure Number: 1A
Published Date: 2019-06-27
First Author: G�mez-Zambrano, A., Merini, W., et al.
Impact Factor: 13.783
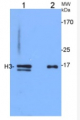
Open PublicationA modified form of H2A.Z is required to regulate flowering time. a Western blot (WB) analysis of HTA9 levels in histone enriched extracts of wild-type (WT) and hta9hta11 mutants at 7 days after germination (DAG; upper panel). The same blot was probed with anti-H4 antibody for loading control (bottom panel). Arrows indicate the bands recognized by the antibody. b Schematic representation of the C-terminal region of FLAG-tagged HTA9 native construct (FLAG-HTA9_N) or mutated in which K129 or both K129 and K132 were replaced by R (FLAG-HTA9_RK and FLAG-HTA9_RR, respectively). c WB analysis of HTA9 and FLAG-HTA9 levels in WT, hta9hta11, WT/FLAG-HTA9_N, WT/FLAG-HTA9_RK, and WT/FLAG-HTA9_RR (upper panel). Arrows indicate the bands recognized by the antibody. The same blot was probed with anti-H4 antibody for loading control (bottom panel). d Picture showing WT, hta9hta11, hta9hta11/FLAG-HTA9_N, hta9hta11/FLAG-HTA9_RK, and hta9hta11/FLAG-HTA9_RR plants at 24 DAG growing under long day conditions. Arrows indicate the presence of elongated shoot. Bar indicates 1?cm. e Box plots indicating the number of rosette leaves at bolting in different genotypes. “n” indicates the number of plants. In each case, the median (segment inside rectangle), upper and lower quartiles (boxes), and minimum and maximum values (whiskers) are indicated. p Value of significant differences as determined by Student’s t test are indicated. f Relative FT expression levels in the different genotypes at 12 DAG. ACTIN2 (ACT2) was used as an internal control. Error bars indicate standard deviation of n?=?4 biological replicates. Data points are indicated in the bar charts. g Relative FLC expression levels in different genotypes at 12 DAG. ACT2 was used as an internal control. Error bars indicate standard deviation of n?=?4 biological replicates. Data points are indicated in the bar charts. Significant differences as determined by Student’s t test are indicated (**P?
Reactant: Arabidopsis thaliana (Thale cress)
Application: Western Blotting
Pudmed ID: 31249301
Journal: Nat Commun
Figure Number: 1C
Published Date: 2019-06-27
First Author: G�mez-Zambrano, A., Merini, W., et al.
Impact Factor: 13.783
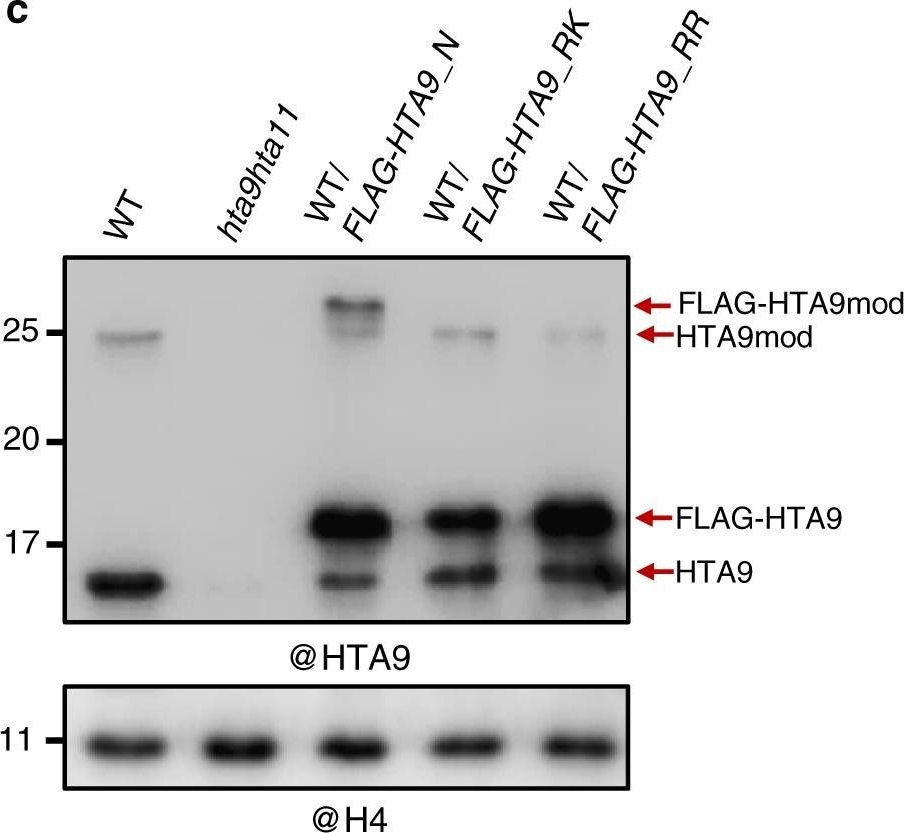
Open PublicationA modified form of H2A.Z is required to regulate flowering time. a Western blot (WB) analysis of HTA9 levels in histone enriched extracts of wild-type (WT) and hta9hta11 mutants at 7 days after germination (DAG; upper panel). The same blot was probed with anti-H4 antibody for loading control (bottom panel). Arrows indicate the bands recognized by the antibody. b Schematic representation of the C-terminal region of FLAG-tagged HTA9 native construct (FLAG-HTA9_N) or mutated in which K129 or both K129 and K132 were replaced by R (FLAG-HTA9_RK and FLAG-HTA9_RR, respectively). c WB analysis of HTA9 and FLAG-HTA9 levels in WT, hta9hta11, WT/FLAG-HTA9_N, WT/FLAG-HTA9_RK, and WT/FLAG-HTA9_RR (upper panel). Arrows indicate the bands recognized by the antibody. The same blot was probed with anti-H4 antibody for loading control (bottom panel). d Picture showing WT, hta9hta11, hta9hta11/FLAG-HTA9_N, hta9hta11/FLAG-HTA9_RK, and hta9hta11/FLAG-HTA9_RR plants at 24 DAG growing under long day conditions. Arrows indicate the presence of elongated shoot. Bar indicates 1?cm. e Box plots indicating the number of rosette leaves at bolting in different genotypes. “n” indicates the number of plants. In each case, the median (segment inside rectangle), upper and lower quartiles (boxes), and minimum and maximum values (whiskers) are indicated. p Value of significant differences as determined by Student’s t test are indicated. f Relative FT expression levels in the different genotypes at 12 DAG. ACTIN2 (ACT2) was used as an internal control. Error bars indicate standard deviation of n?=?4 biological replicates. Data points are indicated in the bar charts. g Relative FLC expression levels in different genotypes at 12 DAG. ACT2 was used as an internal control. Error bars indicate standard deviation of n?=?4 biological replicates. Data points are indicated in the bar charts. Significant differences as determined by Student’s t test are indicated (**P?
Reactant: Arabidopsis thaliana (Thale cress)
Application: Western Blotting
Pudmed ID: 31249301
Journal: Nat Commun
Figure Number: 2A
Published Date: 2019-06-27
First Author: G�mez-Zambrano, A., Merini, W., et al.
Impact Factor: 13.783
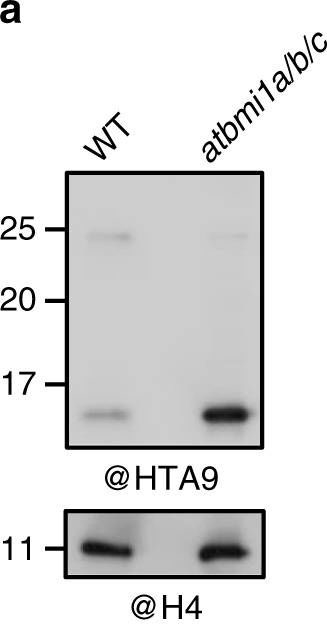
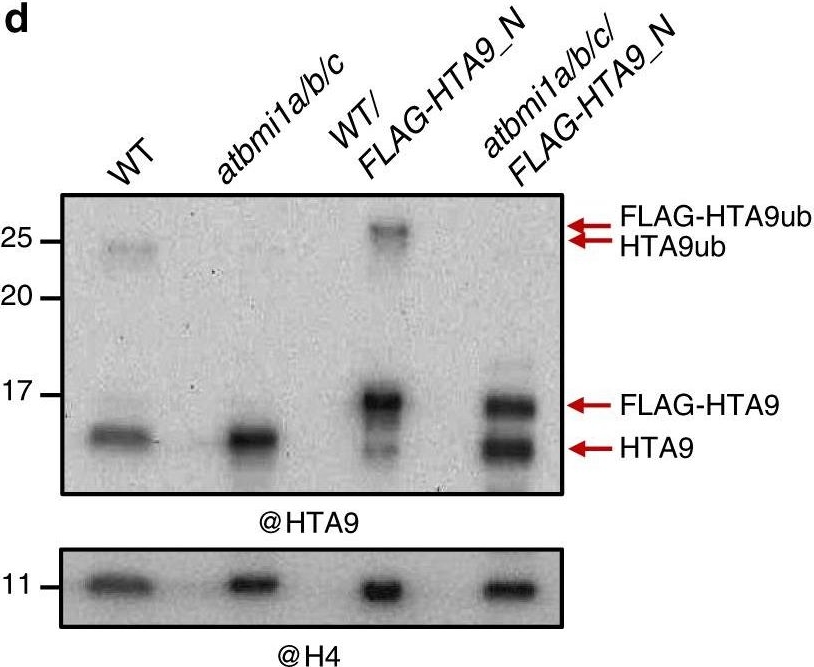
Open PublicationThe AtBMI1 proteins mediate H2A.Z monoubiquitination. a Western blot (WB) analysis of HTA9 levels in histone-enriched extracts of wild-type (WT) and atbmi1a/b/c mutant at 7 days after germination (DAG). The same blot was probed with anti-H4 antibody for loading control. b Quantification of HTA9 and HTA9ub levels in WT and atbmi1a/b/c mutant relative to H4; Error bars indicate standard deviation of n?=?3 independent experiments. Data points are indicated in the bar charts. c WB analysis of WT and atbmi1a/b/c mutant histone-enriched extracts at 7 DAG probed with anti-ubiquitin antibody. Bands corresponding to H2Bub, H2AK121ub, and HTA9ub are indicated. A blot probed with anti-H4 antibody was used as a loading control. d WB analysis of HTA9 and FLAG-HTA9 levels in WT, atbmi1a/b/c, WT/FLAG-HTA9_N, and atbmi1a/b/c/FLAG-HTA9_N. Arrows indicate the bands recognized by the antibody. The same blot was probed with anti-H4 antibody for loading control. Source data of Fig. 2a–d are provided as a Source Data file
Reactant: Arabidopsis thaliana (Thale cress)
Application: Western Blotting
Pudmed ID: 31249301
Journal: Nat Commun
Figure Number: 2D
Published Date: 2019-06-27
First Author: G�mez-Zambrano, A., Merini, W., et al.
Impact Factor: 13.783
Open PublicationThe AtBMI1 proteins mediate H2A.Z monoubiquitination. a Western blot (WB) analysis of HTA9 levels in histone-enriched extracts of wild-type (WT) and atbmi1a/b/c mutant at 7 days after germination (DAG). The same blot was probed with anti-H4 antibody for loading control. b Quantification of HTA9 and HTA9ub levels in WT and atbmi1a/b/c mutant relative to H4; Error bars indicate standard deviation of n?=?3 independent experiments. Data points are indicated in the bar charts. c WB analysis of WT and atbmi1a/b/c mutant histone-enriched extracts at 7 DAG probed with anti-ubiquitin antibody. Bands corresponding to H2Bub, H2AK121ub, and HTA9ub are indicated. A blot probed with anti-H4 antibody was used as a loading control. d WB analysis of HTA9 and FLAG-HTA9 levels in WT, atbmi1a/b/c, WT/FLAG-HTA9_N, and atbmi1a/b/c/FLAG-HTA9_N. Arrows indicate the bands recognized by the antibody. The same blot was probed with anti-H4 antibody for loading control. Source data of Fig. 2a–d are provided as a Source Data file
Reactant: Arabidopsis thaliana (Thale cress)
Application: Western Blotting
Pudmed ID: 31249301
Journal: Nat Commun
Figure Number: 3E
Published Date: 2019-06-27
First Author: G�mez-Zambrano, A., Merini, W., et al.
Impact Factor: 13.783
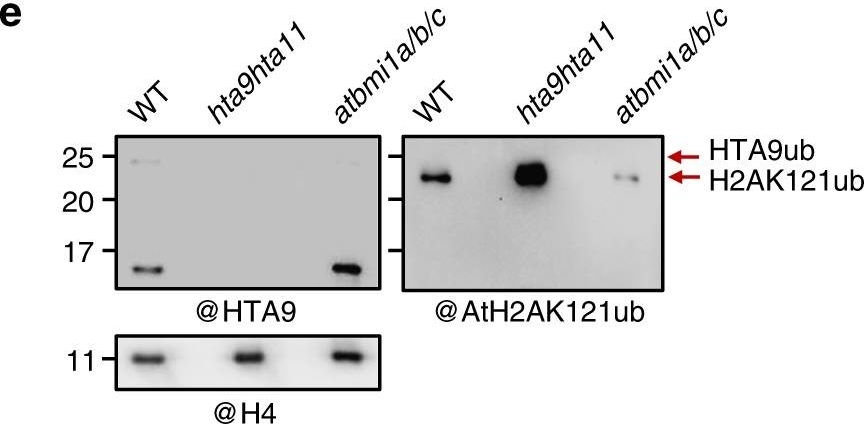
Open PublicationOverlap between upregulated genes in hta9hta11 and atbmi1a/b. a Venn diagram showing the number of overlapping genes when comparing H2A.Z-enriched genes in wild-type (WT) seedlings (H2A.Z_WT), upregulated genes in hta9hta11, and upregulated genes in atbmi1a/b weak mutant. b Metagene plots showing H2A.Z levels over different subsets of genes grouped according to their expression levels (indicated in FPKM (fragments per kilobase of exon and million mapped reads) and different colors). TSS transcription start site, TES transcription stop site. c Metagene plots showing H2A.Z enrichment in WT at genes upregulated in hta9hta11 and atbmi1a/b weak mutants and at genes downregulated in hta9hta11. d Venn diagram showing the number of overlapping genes when comparing H2A.Z-enriched genes in WT (H2A.Z_WT), H2AK121ub marked genes in WT (H2AK121ub_WT), and upregulated genes in hta9hta11. e WB blot showing H2AK121ub and HTA9ub levels in WT, hta9hta11, and atbmi1a/b/c (right and left panels, respectively). The blot was probed with an anti-AtH2AK121ub antibody, then stripped and re-probed with anti-HTA9 antibody. Arrows indicate the bands recognized by the antibody. The same blot was probed with anti-H4 antibody for loading control (bottom panel). Source data of Fig. 3e are provided as a Source Data file
- Background
-
Background: Variant histone H2A may replace conventional H2A in a subset of nucleosomes. Synonymes: H2A.F/Z 3
- Product Citations
-
Selected references: Bieluszewski et al. (2022) NuA4 and H2A.Z control environmental responses and autotrophic growth in Arabidopsis. Nat Commun. 2022 Jan 12;13(1):277. doi: 10.1038/s41467-021-27882-5. PMID: 35022409; PMCID: PMC8755797.
Bieluszewski et al. (2022) NuA4 and H2A.Z control environmental responses and autotrophic growth in Arabidopsis. Nat Commun. 2022 Jan 12;13(1):277. doi: 10.1038/s41467-021-27882-5. PMID: 35022409; PMCID: PMC8755797.
Kralemann et al. (2020). Removal of H2Aub1 by ubiquitin-specific proteases 12 and 13 is required for stable Polycomb-mediated gene repression in Arabidopsis. Genome Biol. 2020 Jun 16;21(1):144.doi: 10.1186/s13059-020-02062-8.
G�mez-Zambrano et al. (2019). The repressive role of Arabidopsis H2A.Z in transcriptional regulation depends on AtBMI1 activity. Nat Commun. 2019 Jun 27;10(1):2828. doi: 10.1038/s41467-019-10773-1.
G�mez-Zambrano et al. (2018). Arabidopsis SWC4 Binds DNA and Recruits the SWR1 Complex to Modulate Histone H2A.Z Deposition at Key Regulatory Genes. Mol Plant. 2018 Mar 29. pii: S1674-2052(18)30122-9. doi: 10.1016/j.molp.2018.03.014.
- Protocols
-
Agrisera Western Blot protocol and video tutorials
Protocols to work with plant and algal protein extracts
Agrisera Educational Posters Collection
- Reviews:
-
Dr. Pedro Crevill�n | 2018-05-25Agrisera anti-HTA9 AS10 718 is an excellent antibody to follow Arabidopsis H2A.Z levels by western blot and chromatin immunoprecipitation experiments (ChIP). We have used anti-HTA9 for ChIP and ChIP-seq experiments in Arabidopsis thaliana and the results obtained are in agreement with previously published data using other techniques.
Accessories
AS09 602 | Clonality: Polyclonal | Host: Goat | Reactivity: Rabbit IgG (H&L)
AS11 1801 | Clonality: Polyclonal | Host: Rabbit | Reactivity: A. thaliana, N. tabacum
AS10 710 | Clonality: Polyclonal | Host: Rabbit | Reactivity: A. thaliana, B. cinerea, C. reinhardtii, H. vulgare, S. lycopersicum, V. faba, P. tricornutum, P. patens, S. europaea, Z. mays | cellular [compartment marker] of nucleoplasm