1
Anti-ACT | Actin (polyclonal)
AS13 2640 | Clonality: Polyclonal | Host: Rabbit | Reactivity: Actinidia sp., Agostis stoloniferacv. ‘Penncross’,Arabidopsis thaliana, Brassica sp., Cannabis sativa L., Cucumis sativus, Cynara cardunculus, Glycine max, Hordeum vulgare, Nicotiana tabacum, Phaseolus vulgaris, Phoenix dactylifera, Picrorhiza kurroa, Raphanus sativus, Setaria italica, Setaria viridis, Solanum tuberosum, Triticum aestivum, Zea mays
- Product Info
-
Immunogen: ca. 100 amino acids of recombinant actin conserved more than 80% in Arabidopsis thaliana: actin-1 P0CJ46 AT2G37620, actin-2 Q96292 AT3G18780, actin-3 P0CJ47 AT3G53750, actin-4 P53494 AT5G59370, actin-5 Q8RYC2 At2g42100, actin-7 P53492 At5g09810, actin-8 Q96293 AT1G49240 , actin-11 P53496 , AT3G12110 ,actin-12 P53497 AT3G46520
Host: Rabbit Clonality: Polyclonal Purity: Serum Format: Lyophilized Quantity: 50 µl Reconstitution: For reconstitution, add 50 µl of sterile water Storage: Store lyophilized/reconstituted at -20°C; once reconstituted make aliquots to avoid repeated freeze-thaw cycles. Please remember to spin the tubes briefly prior to opening them to avoid any losses that might occur from material adhering to the cap or sides of the tube. Tested applications: Expansion microscopy (ExM), immunofluorescence (IF), Western blot (WB) Recommended dilution: 1: 250 (ExM), 1-100 - 1 : 250 (IF), 1 : 3000-1 : 5000 (WB) Expected | apparent MW: 41.6 | 45 kDa - Reactivity
-
Confirmed reactivity: Actinidia sp., Agostis stoloniferacv. ‘Penncross’, Arabidopsis thaliana, Brassica napus, Cucumis sativus, Cyanthobasis fruticulosa, Cynara cardunculus, Fragaria x ananassa,, Glycine max, Hordeum vulgare, Mentha spicata, Nicotiana tabacum, Odontarrhena lesbiaca, Petrosimonia nigdeensis, Phaseolus vulgaris, Phaeodactylum tricornutum, Phoenix dactylifera, Picrorhiza kurroa, Prunus avium, Salsola grandis, Salsola tragus, Setaria italica, Solanum tuberosum, Triticum aestivum, Vigna unguiculata, Vitis vinifera, Zea mays Predicted reactivity: Agropyron cristatum, Beta vulgaris, Betula luminifera, Brassica rapa subsp. pekinensis, Daucus carota, Cannabis sativa L. , Capsella rubella,¨Capsicum annuum, Castanea sativa, Chorispora bungeana, Cyanidioschyzon merolae strain 10D, Glycine soja, Halogeton glomeratus, Helianthus annuus, Ipomoea batatas, Manihot esculenta, Medicago truncatula, Malus domestica, Oryza sativa, Pisum sativun, Populus sp., Saccharum officinarum, Solanum lycopersicum, Phaeodactylum tricornutum, Picea abies, Picea sitchensis, Prunus avium, Olea europaea, Ricinus communis, Rubus plicatus, Theobroma cacao, Trebouxia sp., Vicia faba
Species of your interest not listed? Contact usNot reactive in: Chlamydomonas reinhardtii (too high background for this species)
- Application Examples
-
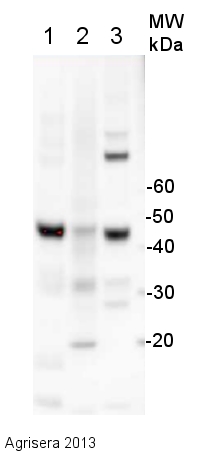
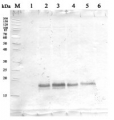
15 µg of total protein extracted with PEB (AS08 300) from leaf tissue of (1) Arabidopsis thaliana, (2) Hordeum vulgare, (3) Zea mays were separated on 4-12% NuPage (Invitrogen) LDS-PAGE and blotted 1h to PVDF. Filters were blocked 1h with 2% low-fat milk powder in TBS-T (0.1% TWEEN 20) and probed with anti-actin (AS13 2640, 1:2500, 1h) and secondary anti-rabbit (1:10 000, 1 h) antibody (HRP conjugated, recommended secondary antibody AS09 602) in TBS-T containing 2% low fat milk powder. Antibody incubations were followed by washings in TBS-T (15, +5, +5, +5 min). All steps were performed at RT with agitation. Signal was detected with chemiluminescent detection reagent using a Fuji LAS-3000 CCD (300s, standard sensitivity). Exposure time was 2 min.
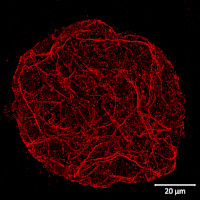
Type of material: isolated plant protoplasts from Arabidopsis thaliana wild type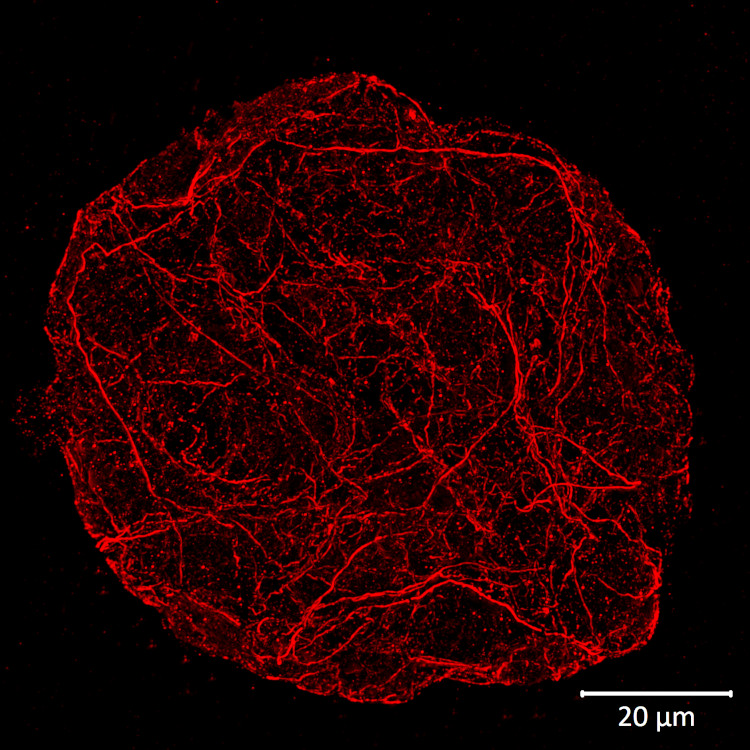
Fixation: formaldehyde | Methanol, 37°C | 3.2 % paraformaldehyde in W5 buffer (150 mM NaCl, 125 mM CaCl2, 5 mM KCl, 2 mM MES pH 5.7), fixed overnight at +4ºC Hydrophilization: no
Cell wall digestion: yes
Membrane permeabilization: DMSO-IGEPA
Antigen retrieval: no
Blocking buffer: 2% BSA in 1X Phosphate Buffered Saline (PBS) buffer pH 7.2
Washing buffer: after primary antibody incubation 3 washes were done with 2% BSA in 1X PBS buffer, after secondary antibody incubation – with 1X PBS buffer
Primary antibody dilution and incubation time: 1:250 in blocking buffer, incubation was done overnight at +4ºC
Secondary antibody dilution and incubation time and supplier: anti-rabbit antibody conjugated with DyLight™ 594 (AS12 2076, Agrisera), diluted in a blocking buffer to a final concentration of 1:500.
Incubation time: 3 hours at room temperature on a shaker.
Co-staining of the nucleus (DAPI): no
Cell wall and nucleus staining: no
Details of the ExM (Expansion microscopy method) on A. thaliana and Zea mays protoplasts are described here.
Courtesy Dr. Kirk Czymmek, The Donald Danforth Plant Science Center, USA

Actin cytoskeleton in 5 days old Arabidopsis thaliana seedlings. Actin signal shown in green, PIN1 in red and DAPI in blue. The material has been fixed in 2 % formaldehyde for 45 minutes. Tissue cleaning has been performed before immunolocalization. Rabbit anti-actin primary antibody was diluted in 1:250 and anti-rabbit Alexa 488 and Alexa 555 were both diluted in 1: 500 (Invitrogen). Scale bar - 20 µm.
Courtesy: Dr. Taras Pasternak, Freiburg University, Germany
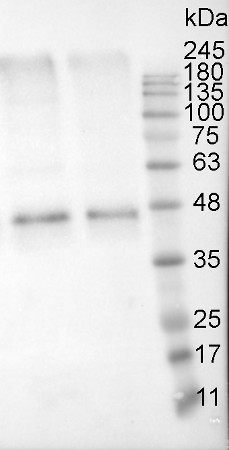
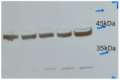
Proteins were extracted from tuber flesh of Russet Burbank potato (Solanum tuberosum) with 0.1 M Tris HCl (pH=8.0), 5% sucrose (m/v), 2% (m/v) SDS, protease inhibitors (PMSF 1mM). Samples were heated 95°C 5 min, and 10 μg of total protein was resolved in 12% SDS PAGE and blotted to PVDF membrane for 1h-1.5h using tank transfer. Blots were blocked with a skimmed milk 4% (m/v) in T-TBS (1.5h) at RT with agitation. Primary antibodies (AS13 2640) were applied overnight +4°C in dilution 1:5000 with agitation. After washing with T-TBS 2-3 times, membrane was incubated with secondary antibodies (Goat Anti-Rabbit HRP conjugate, Transgen biotech HS101) 1:10000 for 1 hour at RT. Blot was washed as above and developed with ECL (Clarity Western ECL Substrate, BioRad, 170-5060) for 5 – 10 minutes. Exposure time – 20.395 seconds.
Courtesy of Iauhenia Isayenka, University of Sherbrooke, CanadaApplication examples:
Reactant: Solanum lycopersicum (Tomato)
Application: Western Blotting
Pudmed ID: 26347766
Journal: Front Plant Sci
Figure Number: 6A
Published Date: 2015-09-09
First Author: Buxa, S. V., Degola, F., et al.
Impact Factor: 5.435
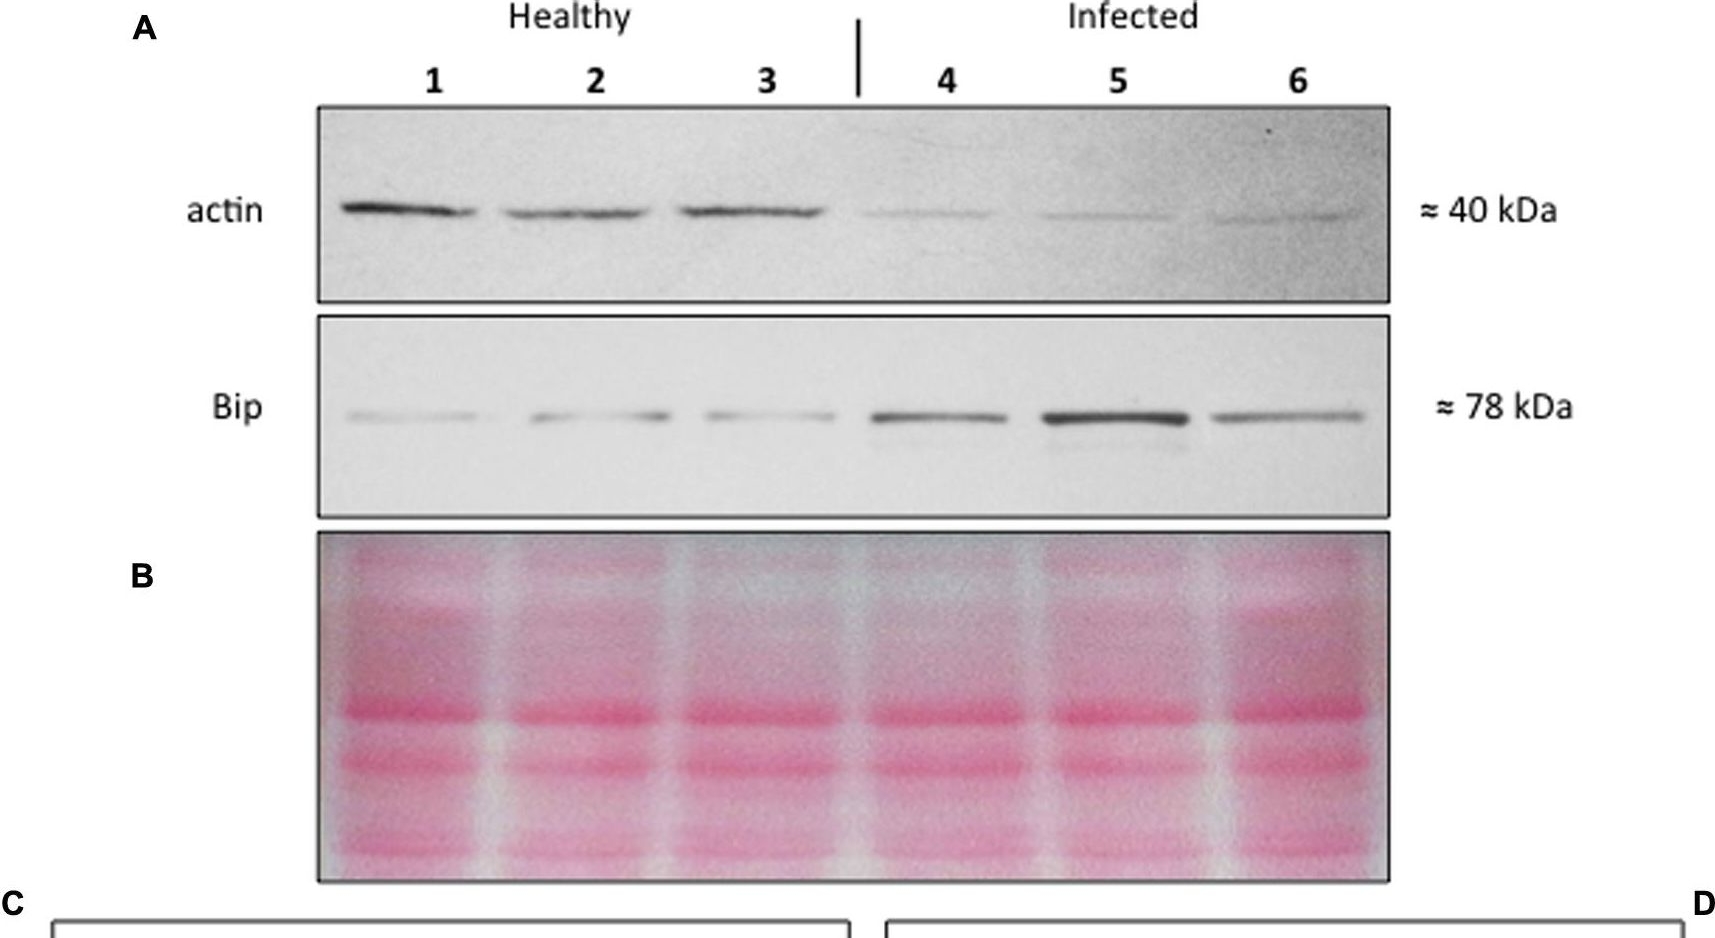
Open Publication(A–D) Western blot analyses of S. lycopersicum midrib extracts. Three healthy (lanes 1–3) and three infected (lanes 4–6) plants were analyzed. Immunoreactive signals corresponding to actin and ER luminal binding protein (BiP) displayed the expected molecular weights of ?40 and ?78 kDa, respectively (A). Amount of loaded protein were checked by Ponceau-S staining (B). Quantification of immunoreactive luminescence signals was achieved by densitometric scanning of the respective actin (C) and BiP (D) bands. The mean of six replicates (±SD) was calculated for each sample. Actin T-value: –9.977; BiP T-value: 15.068. * denotes significant difference of the means (P-values ? 0.001).
Reactant: Arabidopsis thaliana (Thale cress)
Application: Western Blotting
Pudmed ID: 27406783
Journal: J Exp Bot
Figure Number: 7A
Published Date: 2016-09-01
First Author: Sztatelman, O., ?abuz, J., et al.
Impact Factor: 6.088
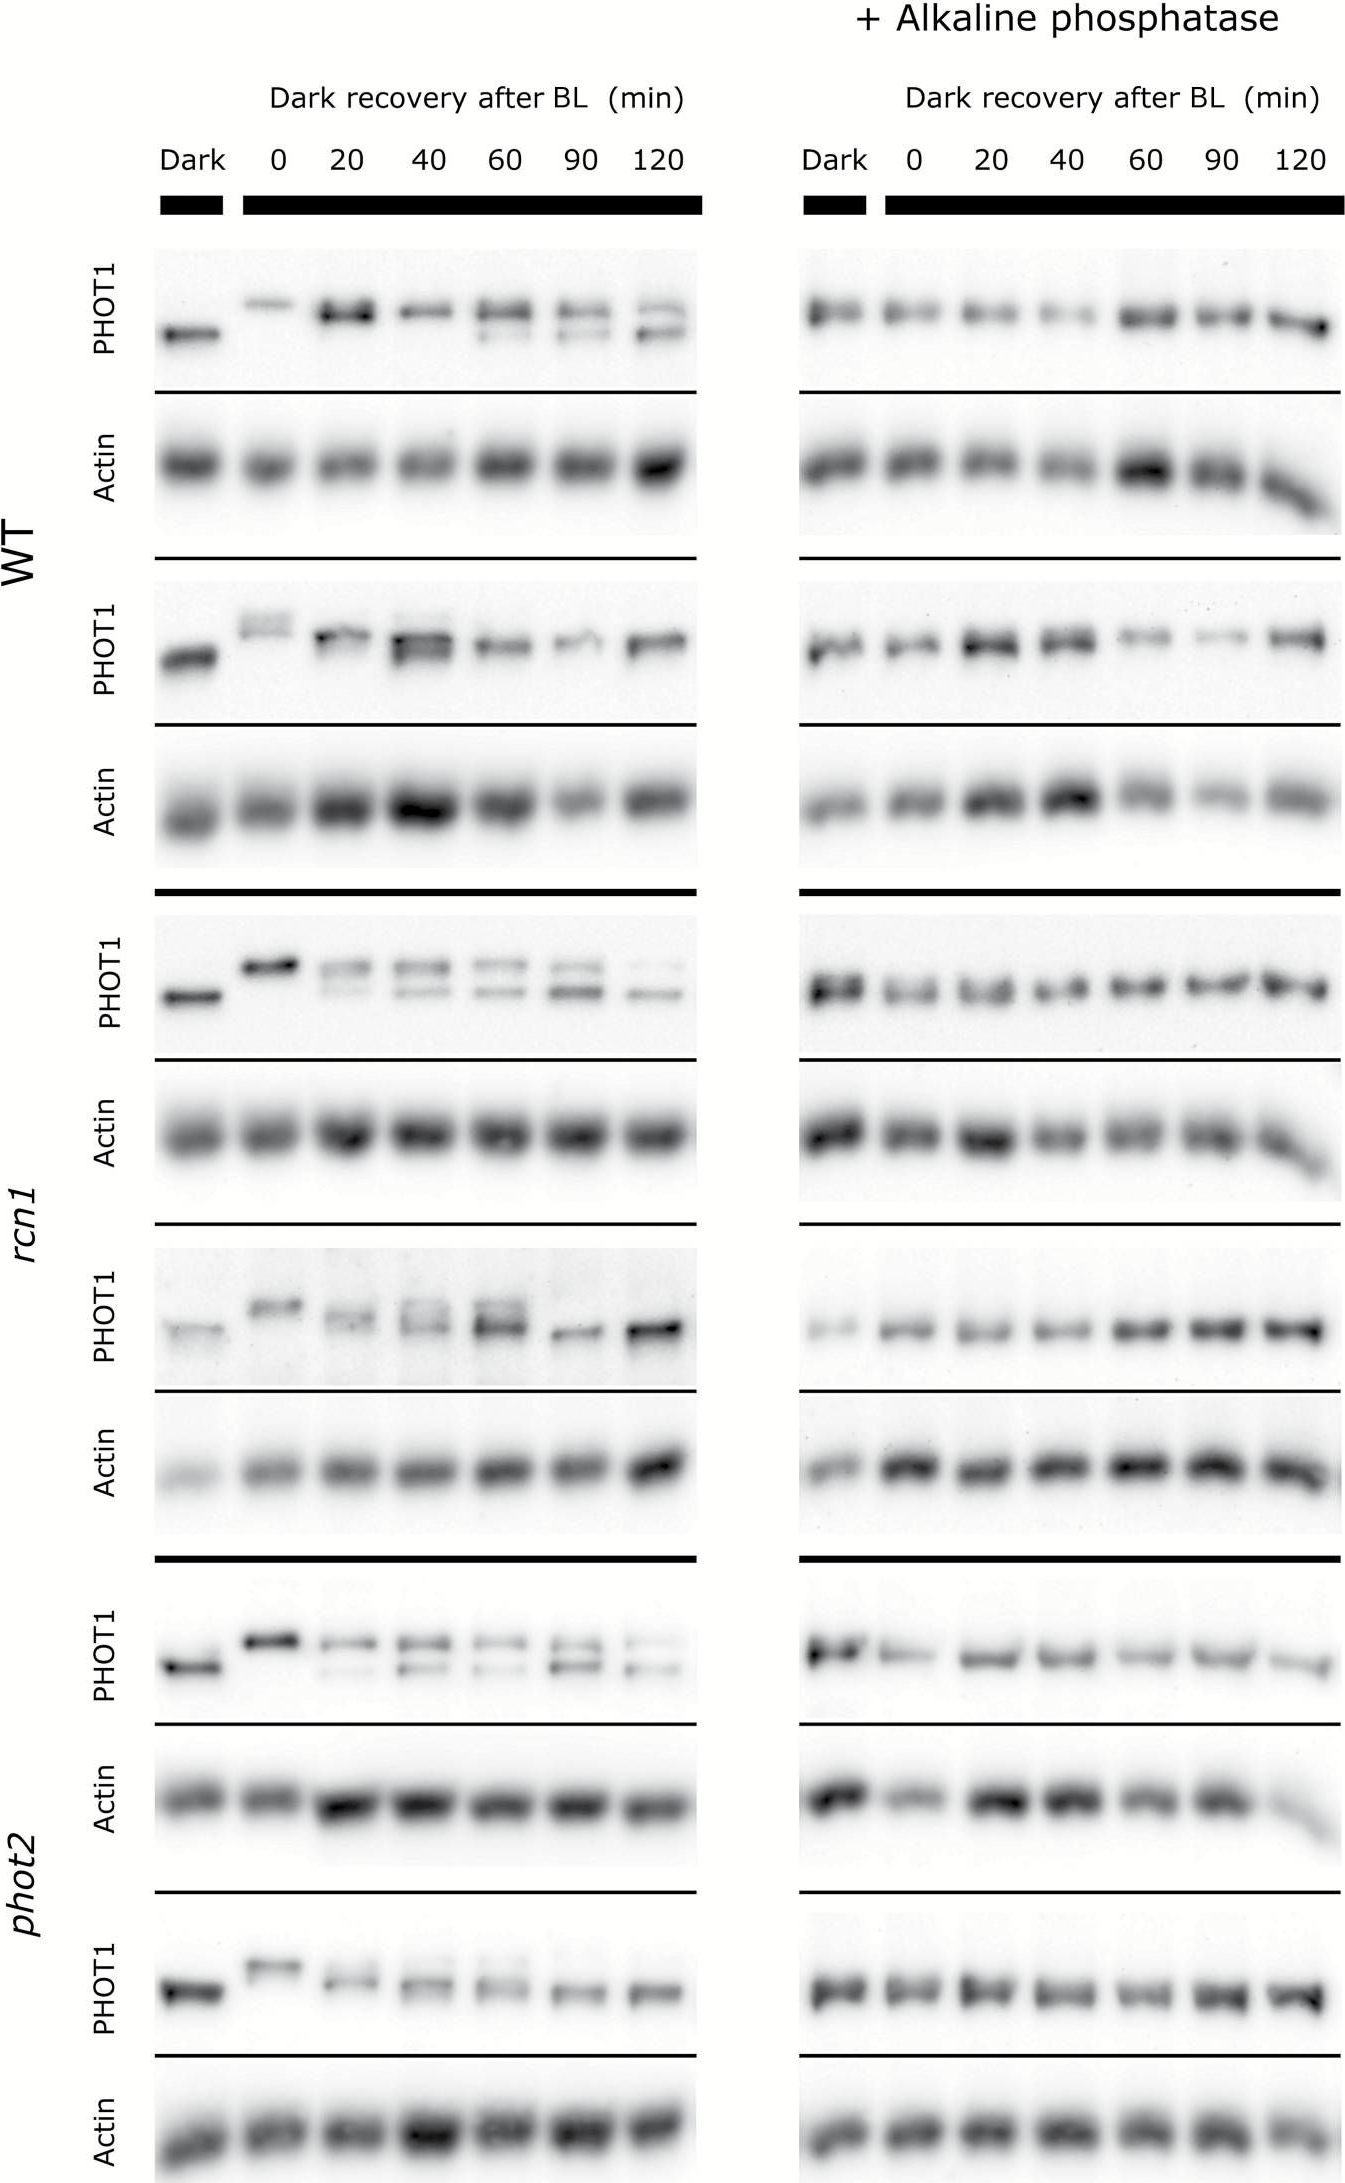
Open PublicationRepresentative dephosphorylation profiles of phototropin1 after blue light exposure (120 µmol m?2 s?1 and 1h) in Arabidopsis wild-type and mutant (phot2 and rcn1) leaves. Dark, a dark-adapted control; 0, a sample collected just after illumination. The duration of the incubation in the darkness after the end of the illumination is indicated in minutes. Phosphorylation leads to the shift of the phototropin band towards higher mass. Samples treated with alkaline phosphatase are shown on the right. Anti-actin blots are presented as the loading reference. The results represent two out of 4–5 independent biological replicates.
Reactant: Ralstonia solanacearum
Application: Western Blotting
Pudmed ID: 29265643
Journal: Plant Biotechnol J
Figure Number: 4A
Published Date: 2018-07-01
First Author: Wei, Y., Caceres-Moreno, C., et al.
Impact Factor: 8.66
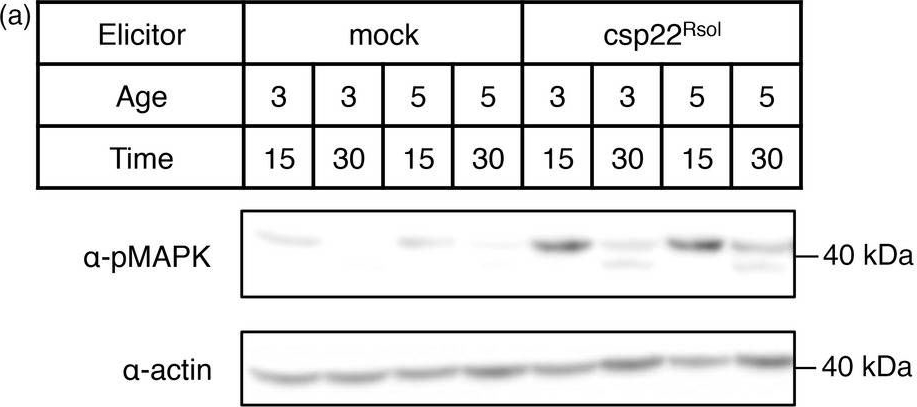
Open PublicationCsp22 from Ralstonia solanacearum triggers additional early and late PRR?dependent immune responses in Solanaceae plants. (a) MAPK activation assay in leaves of 3? or 5?week?old Nicotiana benthamiana plants after treatment with 1 ?m csp22Rsol or water (mock) for 15 or 30 min as indicated. Immunoblots were analysed using antiphosphorylated MAPK antibody (??pMAPK). Immunoblots were also analysed using ??actin antibody to verify protein accumulation. Molecular weight (kDa) marker bands are indicated for reference. (b) Growth inhibition of N. benthamiana seedlings treated with 100 nm flg22Pto, csp22Rsol or water (mock) for 9 days. Values represent seedling weigh shown as percentage of mock?treated seedlings (average ± SE; n = 12). (c) Photograph of seedlings after exposure to the different elicitors in (b). (d) Growth of R. solanacearum GMI1000 in tomato (cultivar M82) leaves pretreated with 1 ?m csp22Rsol or water (mock) for 24 h and then syringe?infiltrated with a 106 cfu/mL bacterial inoculum. Bacterial growth was determined 3 days after inoculation. Values are mean ± SE (n = 3). Asterisks indicate significant differences compared to the mock control according to a Student's t?test (P < 0.001). All experiments were performed three times with similar results.
Reactant: Arabidopsis thaliana (Thale cress)
Application: Western Blotting
Pudmed ID: 29365132
Journal: J Exp Bot
Figure Number: 1B
Published Date: 2018-03-14
First Author: Minina, E. A., Moschou, P. N., et al.
Impact Factor: 6.088
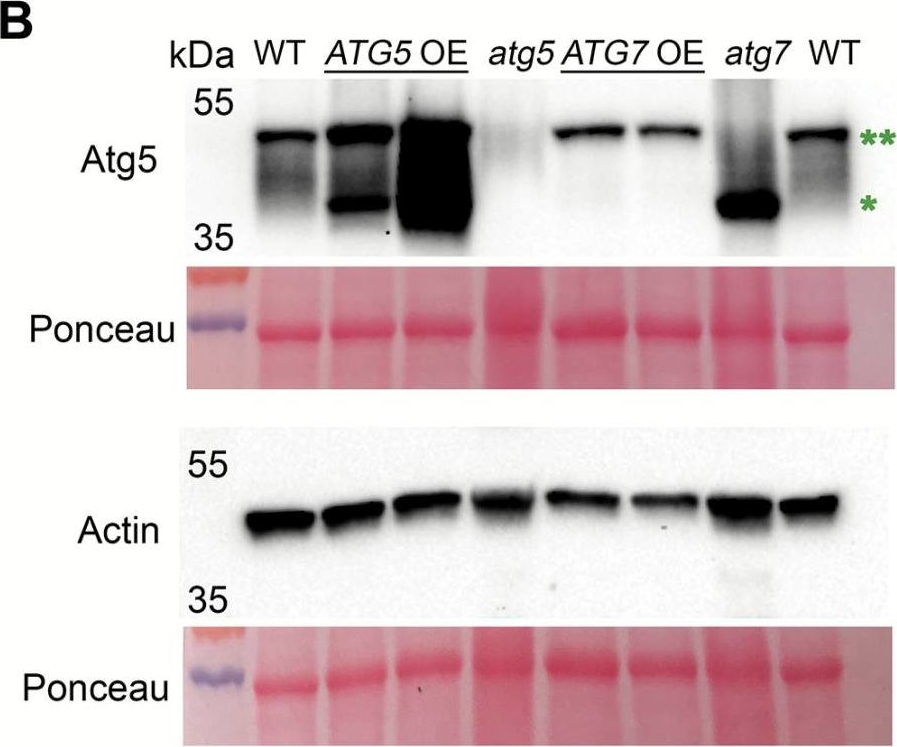
Open PublicationConstitutive overexpression of ATG5 or ATG7 in Arabidopsis stimulates lipidation of Atg8. (A) A schematic representation of two autophagy-related ubiquitin-like conjugation systems (Nakatogawa, 2013). Atg7 acts as an E1-like ligase by stimulating conjugation of two substrate pairs: of a ubiquitin-like protein Atg12 with its E2-like ligase, Atg10, and of a ubiquitin-like protein Atg8 with its E2-like ligase, Atg3. Atg12 is further transferred from Atg10 onto Atg5 protein in an E3-ligase-independent manner. The Atg12–Atg5 conjugate forms a complex with Atg16 and gains an E3-like ligase activity. Atg12–Atg5–Atg16 E3-like ligase stimulates conjugation of Atg8 with a phosphatidylethanolamine (PE), followed by anchoring of Atg8–PE on a membrane of a growing phagophore. Double green and double red asterisks indicate Atg12–Atg5 and Atg8–PE conjugates, respectively, also shown on the western blots on (B) and (D). (B) Atg5, but not Atg7, is a limiting component in the Atg12–Atg5 conjugation pathway. Western blot detection of Atg5 in rosette leaves of Col-0 (WT), two individual ATG5- or ATG7-overexpressing lines (ATG5 OE or ATG7 OE, respectively), and ATG5- or ATG7-knockout (atg5 or atg7, respectively) mutants. *Atg5; **Atg12–Atg5 conjugate. The experiment was repeated four times, using three individual lines of each overexpressor background. Western blot detection of actin and Ponceau staining were used as loading controls. (C) Densitometry of the Atg5–Atg12 conjugate in (B). Integrated density of bands corresponding to the Atg5–Atg12 conjugate were first normalized to the corresponding values for actin and then expressed as a percentage of the obtained value for the WT. Data represent means ±SE; n=6. Mean values denoted by the same letter do not differ significantly at P<0.001 (Student’s t-test). (D) Up-regulation of either ATG5 or ATG7 stimulates lipidation of Atg8. Seven-day-old seedlings of Col-0 (WT), atg5, ATG5 OE, atg7, and ATG7 OE genotypes were incubated for 3 d under 150 µE m–2 s–1 light, 16 h photoperiod (Light) or in the darkness (Dark). Total proteins were fractionated by ultracentrifugation and used for western blot analysis to detect free (*) and lipidated (**) forms of Atg8. C, crude extract; S, supernatant of 100000 g fraction; M, pellet of 100000 g fraction, containing membranes. (E) Densitometry of the Atg8–PE conjugate in (D). Integrated density of bands corresponding to the Atg8–PE in the crude fraction was expressed as a percentage of the integrated density of the total amount of Atg8 in the corresponding sample. Data represent means ±SE; n=6. Mean values denoted by the same letter do not differ significantly at P<0.001 (Student’s t-test). L, light; D, dark.
Reactant: Arabidopsis thaliana (Thale cress)
Application: Western Blotting
Pudmed ID: 29365132
Journal: J Exp Bot
Figure Number: 2C
Published Date: 2018-03-14
First Author: Minina, E. A., Moschou, P. N., et al.
Impact Factor: 6.088
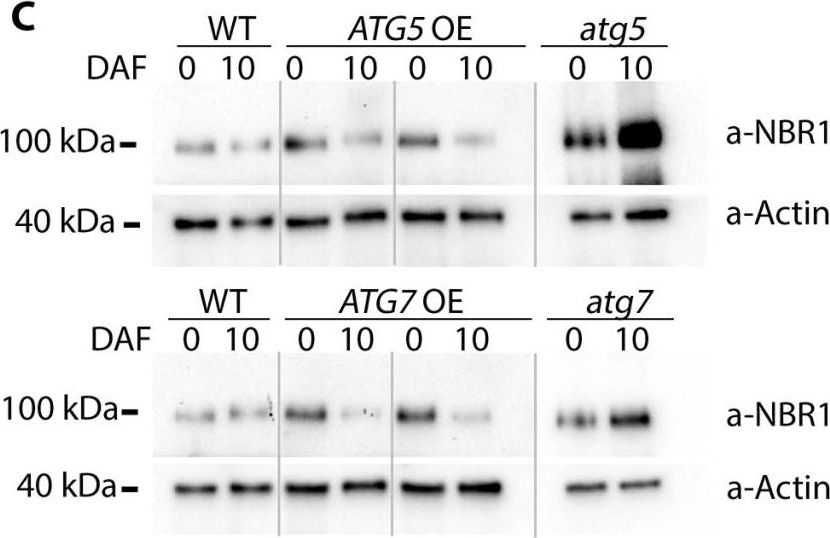
Open PublicationConstitutive overexpression of ATG5 or ATG7 stimulates formation of autophagosomes and increases autophagic flux. (A) Representative confocal microscopy images of the epidermal root cells expressing GFP–Atg8a in WT, ATG-knockout, and ATG-overexpressing backgrounds. Seedlings were grown under 150 µE m–2 s–1 light, 16 h photoperiod for 6 d and subjected to 0.5 µM ConA treatment for 16 h prior to imaging. Scale bars=10 µm. (B) The box-plot diagram shows the number of the GFP-positive puncta in the epidermal root cells in (A). The average number of puncta for two or three cells belonging to the same root was considered as a single measurement. Four to seven roots were imaged per genotype. The means of each genotype were compared with the WT using Dunnett’s test, assuming a Poisson distribution of the data. ***P<0.001; ?, outliers. (C) Increase of autophagic flux in ATG5- or ATG7-overexpressing plants confirmed by a higher rate of NBR1 degradation. Plants of the indicated genotypes were grown under 150 µE m–2 s–1. Rosette leaves were sampled at the onset of flowering (0 days after flowering, DAF) and 10 d later (10 DAF). Total protein extracts from sampled leaves were used for western blot analysis to detect NBR1 and actin. (D) Densitometry of the NBR1 signal in (C) and expression level of NBR1 in the same samples. Integrated density values for NBR1 were first normalized to actin and then expressed as a percentage of 0 DAF for the corresponding sample. Data represent means ±SE; n=6. The means of each genotype were compared with the WT using Dunnett’s test, ***P<0.001. Detection of the NBR1 transcript level in ATG-overexpressing plants confirmed that the decrease in NBR1 protein was caused by protein degradation and did not originate from transcriptional variation. qRT-PCR was performed on the same leaf material as in (C). Data represent means ±SE for each genotype, normalized to two reference genes (PP2A and HEL) and to 0 DAF; n=6. The means of each genotype were compared with the WT using Dunnett’s test, ***P<0.001. (E) Increased autophagic flux in ATG5- or ATG7-overexpressing plants additionally confirmed by detection of free GFP accumulation in the seedlings expressing GFP–Atg8a in the indicated backgrounds. Seven-day-old seedlings grown under normal conditions (150 µE m–2 s–1 light, 16 h photoperiod) were either transferred onto sucrose-depleted MS medium and kept in the darkness (–) or left growing under normal conditions (+). Total protein extracts from the whole seedlings of each genotype were used for western blot analysis with anti-GFP. The GFP–Atg8a fusion has a predicted molecular weight of ~40 kDa; free GFP has a predicted molecular weight of 27 kDa. To avoid quantification of saturated pixels, several exposures were used for different samples. Comparisons of the absolute integrated density values for each line were made using the same exposure. For more information, see the Materials and methods. (F) Densitometry of the GFP–ATG8a cleavage assay in (E) confirms elevated autophagic flux in ATG OE backgrounds. The experiment was repeated twice; at least three western blot assays were performed for each experiment. The figure shows a representative example. Free GFP was expressed as a percentage of the total amount of GFP for each sample in (E). Data represent means ±SE of three individual measurements. The means of each genotype were compared with the WT using Dunnett’s test, ***P<0.001.
- Additional Information
-
Additional information: Antibody available in 3 various pack sizes: 50, 100 and 150 µl - Please inquire.
This product can be sold containing ProClin if requested.
- Background
-
Background: Actin is a highly conserved protein and an essential component of cell cytoskeleton and plays an important role in cytoplasmic streaming, cell shape determination, cell division, organelle movement and extension growth. Preferentially expressed in young and expanding tissues, floral organ primordia, developing seeds and emerging inflorescence. - Product Citations
-
Selected references: Moore et al. (2026). Translation-dependent retrograde signaling coordinates high-light acclimation in plants. Mol Plant. 2026 Jul 7:S1674-2052(26)00221-2. doi: 10.1016/j.molp.2026.07.002.
González-Fuente et al. (2026). Bacteria use P-body condensates to attenuate host translation during infection. Sci Adv . 2026 Apr 24;12(17):eaec4477. doi: 10.1126/sciadv.aec4477.
Brandt et al. (2026). Plants tolerate substantial rates of plastid mistranslation via regulated proteostasis. Proc Natl Acad Sci U S A. 2026 Jun 2;123(22):e2537357123. doi: 10.1073/pnas.2537357123.
Hu et al. (2026). Identification of NtHDAC family genes and functional analysis of NtHDT605 in the cold response of tobacco (Nicotiana tabacum L.). Industrial Crops and Products, Volume 245.
Wilkinson et al. (2026). Nat Commun. 2026 Mar 27;17(1):2883. doi: 10.1038/s41467-026-71012-y. AUXIN RESPONSE FACTOR thermostability.
D'Agostino et al. (2026). Gallic Acid- Responsive microRNAs Reprogram Lignification During Drought Acclimation Process in Spearmint. Plant Biotechnol J . 2026 Mar 14. doi: 10.1111/pbi.70599.
Telara et al. (2026). Hypoxic and Fe-Responses are Regulated by the ERFVII Factors and the PCO Branch of the N-Degron Pathway According to Iron Availability.Plant Cell Environ. 2026 Mar 8. doi: 10.1111/pce.70466.
Yang et al. (2026). GmAP1 delays flowering time and confers sensitivity to salt stress in soybean. Plant Physiology and Biochemistry Volume 232, March 2026, 111163.
Holzner et al. (2026). The chloroplast ionome shines light on the dynamics of organellar iron homeostasis. Plant Cell. 2026 Jan 29:koag017. doi: 10.1093/plcell/koag017.
Piechowiak et al. (2025), Ozone Treatment Enhances Antioxidant Status and Energy Metabolism in Radish (Raphanus sativus) Sprouts. Springer Nature, Food Bioprocess Technology.
Titeli et al. (2025). Transcription factors PaWRKY57 and PaNAC29 regulate fruit color and growth during sweet cherry development. Plant Physiol. 2025 Dec 13:kiaf647. doi: 10.1093/plphys/kiaf647.
Kocacinar et aL. (2025). Biochemical and structural differences between C3 cotyledons and C4 leaves in species of Salsoloideae (Chenopodiaceae). Sci Rep. 2025 Oct 17;15(1):36383.doi: 10.1038/s41598-025-20388-w.
Xiao et al. (2025). A fungal effector promotes infection via stabilizing a negative regulatory factor of chloroplast immunity. Nat Commun. 2025 Jul 29;16(1):6970. doi: 10.1038/s41467-025-62326-4.
Ling et al. (2025). Natural variation of AcEGY3 mediates chloroplastic ROS homeostasis to confer kiwifruit thermotolerance. Nat Commun. 2025 Jul 4;16(1):6184.doi: 10.1038/s41467-025-61593-5.
Sportès et al. (2025). A transcriptomic perspective of P trade in mycorrhizal grapevine. Mycorrhiza. 2025 May 28;35(3):39.doi: 10.1007/s00572-025-01200-z.
Uflewski et al. (2024). The thylakoid proton antiporter KEA3 regulates photosynthesis in response to the chloroplast energy status. Nat Commun. 2024 Mar 30;15(1):2792. doi: 10.1038/s41467-024-47151-5.
Lorrai et al. (2024). Cell wall integrity modulates HOOKLESS1 and PHYTOCHROME INTERACTING FACTOR4 expression controlling apical hook formation. Plant Physiol. 2024 Jul 8:kiae370. doi: 10.1093/plphys/kiae370.
Salesse-Smith et al. (2024). Greater mesophyll conductance and leaf photosynthesis in the field through modified cell wall porosity and thickness via AtCGR3 expression in tobacco. Plant Biotechnol J. 2024 Apr 30.doi: 10.1111/pbi.14364.
Ciesielska et al. (2024). S2P2-the chloroplast-located intramembrane protease and its impact on the stoichiometry and functioning of the photosynthetic apparatus of A. thaliana. Front Plant Sci. 2024 Mar 15:15:1372318. doi: 10.3389/fpls.2024.1372318.
Pavlovič et al. (2024). Diethyl ether anaesthesia inhibits de-etiolation of barley seedlings by locking them in intermediate skoto-photomorphogenetic state. Physiol Plantarum, Volume176, Issue 1.
Soria et al. (2024).Functional resilience: An active oxidative phosphorylation system prevails amid foreign proteins in holoparasitic plants. Current Plant Biology Volume 37, March 2024, 100322.
Blagojevic et al. (2024). Heat stress promotes Arabidopsis AGO1 phase separation and association with stress granule components. iScience. 2024 Feb 6;27(3):109151. doi: 10.1016/j.isci.2024.109151. eCollection 2024 Mar 15.
Gong et al. (2024). HYPK controls stability and catalytic activity of the N-terminal acetyltransferase A in Arabidopsis thaliana. Cell Rep. 2024 Feb 15;43(2):113768.doi: 10.1016/j.celrep.2024.113768.
Llamas et al. (2023). In planta expression of human polyQ-expanded huntingtin fragment reveals mechanisms to prevent disease-related protein aggregation. Nat Aging. 2023 Nov;3(11):1345-1357.doi: 10.1038/s43587-023-00502-1.
Oláh et al. (2023). Suboptimal zinc supply affects the S-nitrosoglutathione reductase enzyme and nitric oxide signaling in Arabidopsis. Plant Stress Volume 10, December 2023, 100250.
Ji et al. (2023). Evolution of a plant growth-regulatory protein interaction specificity. Nat Plants. 2023 Dec;9(12):2059-2070.doi: 10.1038/s41477-023-01556-0.
Kondak et al. (2023).Nickel oxide nanoparticles induce cell wall modifications, root anatomical changes, and nitrosative signaling in ecotypes of Ni hyperaccumulator Odontarrhena lesbiaca. Environ Pollut . 2023 Nov 8:341:122874. doi: 10.1016/j.envpol.2023.122874.
Wang et al. (2023).LHCF15 facilitates the absorption of longer wavelength light and promotes growth of Phaeodactylum tricornutum under red light. Algal Research Volume 75, September 2023, 103249.
Figueroa et al (2023) Protein interactome of 3',5'-cAMP reveals its role in regulating the actin cytoskeleton
Piechowiak et al (2023) Effect of postharvest nicotinamide treatment on NAD+ metabolism and redox status in strawberry fruit during storage
Niron & Türet (2023) pvSPS4 is involved in regulation of root sugar balance in common bean under salt stress
Seo et al. (2023) ZTL regulates thermomorphogenesis through TOC1 and PRR5 [published online ahead of print, 2023 Jan 19]. Plant Cell Environ. 2023;10.1111/pce.14542. doi:10.1111/pce.14542
Hacquard et al. (2022) The Arabidopsis F-box protein FBW2 targets AGO1 for degradation to prevent spurious loading of illegitimate small RNA. Cell Rep. 2022 Apr 12;39(2):110671. doi: 10.1016/j.celrep.2022.110671. PMID: 35417704; PMCID: PMC9035678.
Lakatos et al. (2022). In Arabidopsis thaliana, RNA-Induced Silencing Complex-Loading of MicroRNAs Plays a Minor Regulatory Role During Photomorphogenesis Except for miR163. Front Plant Sci. 2022 Jul 13;13:854869. doi: 10.3389/fpls.2022.854869. PMID: 35909792; PMCID: PMC9326452.
Molnar et al. (2022) Limited Zn supply affects nutrient distribution, carbon metabolism and causes nitro-oxidative stress in sensitive Brassica napus, Environmental and Experimental Botany,Volume 202, 2022, 105032,ISSN 0098-8472,https://doi.org/10.1016/j.envexpbot.2022.105032.
Czernicka et al. (2022). Proteomic Studies of Roots in Hypoxia-Sensitive and -Tolerant Tomato Accessions Reveal Candidate Proteins Associated with Stress Priming. Cells. 2022 Jan 31;11(3):500. doi: 10.3390/cells11030500. PMID: 35159309; PMCID: PMC8834170.
Kumari et al. (2021) In-depth assembly of organ and development dissected Picrorhiza kurroa proteome map using mass spectrometry. BMC Plant Biol. 2021 Dec 22;21(1):604. doi: 10.1186/s12870-021-03394-8. PMID: 34937558; PMCID: PMC8693493.
Mishra, Sahu & Shaw (2021). Insight into the cellular and physiological regulatory modulations of Class-I TCP9 to enhance drought and salinity stress tolerance in cowpea. Physiol Plant. 2021 Aug 30. doi: 10.1111/ppl.13542. Epub ahead of print. PMID: 34459503.
Zhuang et al (2021). EGY3 mediates chloroplastic ROS homeostasis and promotes retrograde signaling in response to salt stress in Arabidopsis. Cell Rep. 2021 Jul 13;36(2):109384. doi: 10.1016/j.celrep.2021.109384. PMID: 34260941.
Ngou et al. (2021) Mutual potentiation of plant immunity by cell-surface and intracellular receptors. Nature. 2021 Mar 10. doi: 10.1038/s41586-021-03315-7. Epub ahead of print. PMID: 33692545.
labuz et al. (2021) Phototropin interactions with SUMO proteins. Plant Cell Physiol. 2021 Feb 17:pcab027. doi: 10.1093/pcp/pcab027. Epub ahead of print. PMID: 33594440.
Khajuria et al. (2020). Photochemical Efficiency Is Negatively Correlated With the Delta 9- Tetrahydrocannabinol Content in Cannabis Sativa L. Plant Physiol Biochem. 2020 Apr 8;151:589-600. doi: 10.1016/j.plaphy.2020.04.003.
Molnar et al. (2020). Nitro-oxidative Signalling Induced by Chemically Synthetized Zinc Oxide Nanoparticles (ZnO NPs) in Brassica Species. Chemosphere, 251, 126419
Roustan et al. (2020). Protein sorting into protein bodies during barley endosperm development is putatively regulated by cytoskeleton members, MVBs and the HvSNF7s. Sci Rep. 2020 Feb 5;10(1):1864. doi: 10.1038/s41598-020-58740-x.
Dalmadi et al. (2019). AGO-unbound cytosolic pool of mature miRNAs in plant cells reveals a novel regulatory step at AGO1 loading. Nucleic Acids Res. 2019 Aug 8. pii: gkz690. doi: 10.1093/nar/gkz690.
Patankar et al. (2019). Functional Characterization of Date Palm Aquaporin Gene PdPIP1;2 Confers Drought and Salinity Tolerance to Yeast and Arabidopsis. Genes (Basel). 2019 May 22;10(5). pii: E390. doi: 10.3390/genes10050390.
Scherer et al. (2019). Pulsed electric field (PEF)-assisted protein recovery from Chlorella vulgaris is mediated by an enzymatic process after cell death. Algal Research, Volume 41, August 2019, 101536.
Czobor et al. (2019). Comparison of the response of alternative oxidase and uncoupling proteins to bacterial elicitor induced oxidative burst. PLoS One. 2019 Jan 10;14(1):e0210592. doi: 10.1371/journal.pone.0210592.
Deng et al. (2019). Integrated proteome analyses of wheat glume and awn reveal central drought response proteins under water deficit conditions. J Plant Physiol. 2019 Jan;232:270-283. doi: 10.1016/j.jplph.2018.11.011.
Zhang et al. (2018) DELLA proteins negatively regulate dark-induced senescence and chlorophyll degradation in Arabidopsis through interaction with the transcription factor WRKY6. Plant Cell Rep. 2018 Jul;37(7):981-992. doi: 10.1007/s00299-018-2282-9. Epub 2018 Mar 24. PMID: 29574486.
Wang et al. (2018). A role of GUNs-Involved retrograde signaling in regulating Acetyl-CoA carboxylase 2 in Arabidopsis. Biochem Biophys Res Commun. 2018 Nov 2;505(3):712-719. doi: 10.1016/j.bbrc.2018.09.144.
Borovik and Grabelnych (2018). Mitochondrial alternative cyanide-resistant oxidase is involved in an increase of heat stress tolerance in spring wheat. J Plant Physiol. 2018 Dec;231:310-317. doi: 10.1016/j.jplph.2018.10.007.
Pan et al. (2018). Comparative proteomic investigation of drought responses in foxtail millet. BMC Plant Biol. 2018 Nov 29;18(1):315. doi: 10.1186/s12870-018-1533-9.
Lopez‐Calcagno et al. (2018). Overexpressing the H‐protein of the glycine cleavage system increases biomass yield in glasshouse and field‐grown transgenic tobacco plants. Plant Biotechnology Journal, May 2018.
Li et al. (2018). Comparative proteomic analysis of key proteins during abscisic acid-hydrogen peroxide-induced adventitious rooting in cucumber (Cucumis sativus L.) under drought stress. Journal of Plant Physiology Volume 229, October 2018, Pages 185-194.
Adhikari et al. (2018). Sulfate improves cadmium tolerance by limiting cadmium accumulation, modulation of sulfur metabolism and antioxidant defense system in maize. Environmental and Experimental Botany Volume 153, September 2018, Pages 143-162.
Brandt et al. (2018). Extended darkness induces internal turnover of glucosinolates in Arabidopsis thaliana leaves. PLoS One. 2018 Aug 9;13(8):e0202153. doi: 10.1371/journal.pone.0202153.
Jespersen et al. (2017). Metabolic Effects of Acibenzolar-S-Methyl for Improving Heat or Drought Stress in Creeping Bentgrass. Front Plant Sci. 2017 Jul 11;8:1224. doi: 10.3389/fpls.2017.01224. eCollection 2017. (western blot, Agostis stolonifera cv. ‘Penncross’)
Qiu et al. (2015). Soy 14-3-3 protein SGF14c, a new regulator of tolerance to salt–alkali stress. Plant Biotechnology Reports pp 1-9.
Shaw et al. (2015). Beta-aminobutyric acid mediated drought stress alleviation in maize (Zea mays L.). Environ Sci Pollut Res Int. 2015 Sep 29.
Buxa et al. (2015). Phytoplasma infection in tomato is associated with re-organization of plasma membrane, ER stacks, and actin filaments in sieve elements. ront Plant Sci. 2015; 6: 650. Published online 2015 Aug 19.
Zheng et al. (2014). iTRAQ-based quantitative proteomics analysis revealed alterations of carbohydrate metabolism pathways and mitochondrial proteins in a male sterile cybrid pummelo. J Proteome Res. 2014 May 13.
Vitale, L.; Vitale, E.; Francesca, S.; Lorenz, C.; Arena, C. Plant-Growth Promoting Microbes Change the Photosynthetic Response to Light Quality in Spinach. Plants 2023, 12, 1149. https://doi.org/10.3390/plants12051149 - Protocols
-
Agrisera Western Blot protocol and video tutorials
Protocols to work with plant and algal protein extracts - Reviews:
-
Peter Ma | 2023-08-22This antibody works very well for our samples. The total proteins from the Arabidopsis roots were subjected to 10% SDS-PAGE and then detected with this antibody (1:2500). The result shows that this antibody is quite specific and sensitive.Ayten Ulusan | 2019-12-16Very goodMicha? Tracz | 2019-11-26Used in dillution of 1:5000 in 0.5 % Milk TBS. Short labeling time is possibile (~ 1 - 1.5 hours). I was using a load equiavelnt of total protein extracted from 1.5 mg leaf wet weight per lane. Some backround bands were detectable, however I believe over 90 % of the signal came from the actin monomer.| 2017-12-06We used this antibody diluted 1:2500 in TBS Tween20 against A. thaliana leave extract to detect purity of fractioning experiments.This AB works quite nice.Francesca | 2014-11-09We succesfully used this ab diluted 1:2500 against S. lycopersicon leaves extracts. Probing was conducted for 1 h in PBS 5% skim milk.D.sa Valeria Banti | 2014-04-03The antibody ACT AS13 2640, made to a recombinant actin, gives a good signal and no nonspecific bands are visible after 100sec of exposition with Extra ensitive ECL (LiteABlot Extra Sensitive Substrate, Euroclone).The immunoblot signal is clearly visible loading 20microgG (maybe less is still ok) of total protein extracted from 4-days-old Arabidopsis thaliana seedling tissue, using 1:5.000 diluition for the primary antibody, the same for the secondary one.In a gradient of protein concentration loaded on 10% SDS polyacrylamide gel (20, 40, 80 microG), the signal increases in a proprortional way and the signal for actin is clear at the expected molecular weight (between 42-45KDa).
Related products
AS09 602 | Clonality: Polyclonal | Host: Goat | Reactivity: Rabbit IgG (H&L)
AS09 607 | Clonality: Polyclonal Host: Goat Reactivity: Rabbit IgG (H&L)
AS21 4615 | Clonality: Monoclonal | Host: Mouse recombinant antibody (animal-free technology) | Reactivity: Arabidopsis thaliana, Eschscholzia californica, Medicago sativa, Nicotiana benthamiana, Nicotiana tabacum, Salvia plebeian, Zea mays
This product replaces AS16 4111