1
Anti-PsbA | D1 protein of PSII, C-terminal (rabbit antibody) (thylakoid membrane marker)
AS05 084 | Clonality: Polyclonal | Host: Rabbit | Reactivity: [global antibody] for higher plants, algae, liverwort, cyanobacteria, diatoms | cellular [compartment marker] of thylakoid membrane
Benefits of using this antibody
- Product Info
-
Immunogen: KLH-conjugated synthetic peptide derived from available plant, algal and cyanobacterial PsbA sequences, including Arabidopsis thaliana UniProt: A4QJR4, TAIR: AtCg00020 , Oryza sativa P0C434, Populus alba Q14FH6, Physcomitrella patens Q6YXN7, Chlamydomonas reinhardtii P07753, Synechocystis sp. P14660 and many others Host: Rabbit Clonality: Polyclonal Purity: Serum Format: Lyophilized Quantity: 50 µl Reconstitution: For reconstitution add 50 µl of sterile water Storage: Store lyophilized/reconstituted at -20°C; once reconstituted make aliquots to avoid repeated freeze-thaw cycles. Please remember to spin the tubes briefly prior to opening them to avoid any losses that might occur from material adhering to the cap or sides of the tube. Tested applications: (BN-PAGE), cryo-Expansion Microscopy (cryo-ExM), Immunofluorescence (IF), ImmunoGold (IG), Western blot (WB) Recommended dilution: 1: 200 (cryo-ExM), 1: 500 (IF), 1: 200 (IG), 1 : 10 000 (WB) Expected | apparent MW: 38 | 28-30 kDa
- Reactivity
-
Confirmed reactivity: Alniaria alnifolia, Anabaena 7120, Arabidopsis thaliana, Artemisia annua, Arundo sp., Begonia sp. , Cannabis sativa L., Cladocopium goreaui, Chlamydomonas reinhardtii, Chlorella ohadii, Chromera velia, Chlorella vulgaris, Colobanthus quitensis (Kunth) Bartl, Coscinodiscus wailesii, Craterostigma sp., Cyanidioschyzon merolae, Cytisus cantabricus (Wilk.) Rchb. F, Desmodesmus sp., Dianthus caryophyllus, Ditylum brightwellii, Eucalyptus globulus, Fraxinus rhynchophylla, Glycine max, Gongolaria barbata,Halomicronema hongdechloris, Hieracium pilosella L., Hordeum vulgare, Lasallia hispanica, Lindernia sp., Manihot esculenta, Marchantia polymorpha (liverwort), Medicago truncatula, Miscanthus x giganteus, Microcystis aeruginosa, Mirkania micrantha, Nicotiana benthamiana, Nicotiana tabcum, Panicum miliaceum, Panax ginseng, Panicum maximum, Paulinella chromatophora (amoeba), Pheodactylum tricornutum CCAP 1055/1, Physcomitrium patens, Picea glauca, Pinus strobus, Pisum sativum, Prochlorococcus sp. (surface and deep water ecotype), Salicornia bigelovii , Skeletonema costatum (diatom), Solanum lycopersicum, Spartina alterniflora, Spinacia oleracea, Spirodela polyrhiza, Symbiodinium sp, Synechococcus sp. PCC 7942, Synechococcus elongatus UTEX 2973, Synechocystis sp. 6803, Syntrichia muralis, Thalassiosira weissflogii, Tetradesmus obliquus, Triticum aestivum, Triticale, Zea may, Quercus ilex Predicted reactivity: Algae (brown and red), Brassica napus, Carica papaya, Conifers, Cyanobacteria, Cannabis sativa, Citrus sinensis, Dicots, Eragrostis tef, Galdieria sulphuraria, Lactuca sativa, Lycopersicum esculentum, Medicago sativa, Nannochloropsis sp., Oryza sativa, Ostreococcus sp., Phalaenopsis aphrodite, Pisum sativum, Porphyridium purpureum, Sesamum indicum, Thalassiosira pseudonana, Zosteria marina, Vitis vinifera cellular [compartment marker] of thylakoid membrane
Species of your interest not listed? Contact usNot reactive in: No confirmed exceptions from predicted reactivity are currently known - Application Examples
-
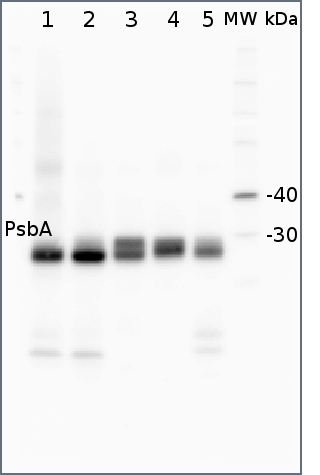
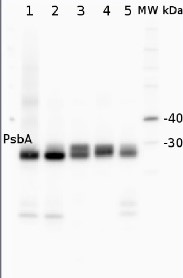
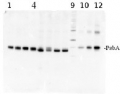
2 µg of total protein from (1) Arabidopsis thaliana leaf extracted with Protein Extration Buffer, PEB (AS08 300), (2) Hordeum vulgare leaf extracted with PEB, (3) Chlamydomonas reinhardtii total cell extracted with PEB, (4) Synechococcus sp. 7942 total cell extracted with PEB, (5) Anabaena sp. total cell extracted with PEB were separated on 4-12% NuPage (Invitrogen) LDS-PAGE and blotted 1h to PVDF. Blots were blocked immediately following transfer in 2% ECL Advance blocking reagent (GE Healthcare) in 20 mM Tris, 137 mM sodium chloride pH 7.6 with 0.1% (v/v) Tween-20 (TBS-T) for 1h at room temperature with agitation. Blots were incubated in the primary antibody at a dilution of 1: 50 000 for 1h at room temperature with agitation. The antibody solution was decanted and the blot was rinsed briefly twice, then washed once for 15 min and 3 times for 5 min in TBS-T at room temperature with agitation. Blots were incubated in secondary antibody (anti-rabbit IgG horse radish peroxidase conjugated, recommended secondary antibody AS09 602) diluted to 1:50 000 in 2% blocking solution for 1h at room temperature with agitation. The blots were washed as above and developed for 5 min with chemiluminescent detection reagent according the manufacturers instructions. Images of the blots were obtained using a CCD imager (FluorSMax, Bio-Rad) and Quantity One software (Bio-Rad).
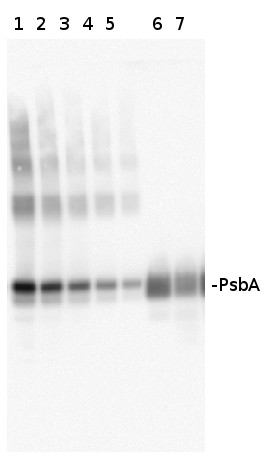
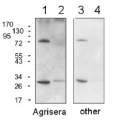
Varying amounts of PsbA protein standard (AS01 016S) 250 fmol (1), 125 fmol (2), 62.5 fmol (3), 31.25 fmol (4), 15.625 fmol (5) and 2 µg of total protein from Med4 (6,7) extracted with Protein Extration Buffer, PEB (AS08 300). Samples were diluted with 1X sample buffer (NuPAGE LDS sample buffer (Invitrogen) supplemented with 50 mM DTT and heat at 70°C for 5 min and keept on ice before loading. Protein samples were separated on 4-12% Bolt Plus gels, LDS-PAGE and blotted for 70 minutes to PVDF using tank transfer. Blots were blocked immediately following transfer in 2% blocking reagent or 5% non-fat milk dissolved in 20 mM Tris, 137 mM sodium chloride pH 7.6 with 0.1% (v/v) Tween-20 (TBS-T) for 1h at room temperature with agitation. Blots were incubated in the primary antibody at a dilution of 1: 10 000 (in blocking reagent) for 1h at room temperature with agitation. The antibody solution was decanted and the blot was rinsed briefly twice, and then washed 1x15 min and 3x5 min with TBS-T at room temperature with agitation. Blots were incubated in secondary antibody (goat anti-rabbit IgG horse radish peroxidase conjugated, recommended secondary antibody AS09 602, Agrisera) diluted to 1:25 000 in blocking reagent for 1h at room temperature with agitation. The blots were washed as above. The blot was developed with chemiluminescent detection reagent according the manufacturers instructions. Images of the blots were obtained using a CCD imager (VersaDoc MP 4000) and Quantity One software (Bio-Rad). Exposure time was 30 seconds.
Application examples: 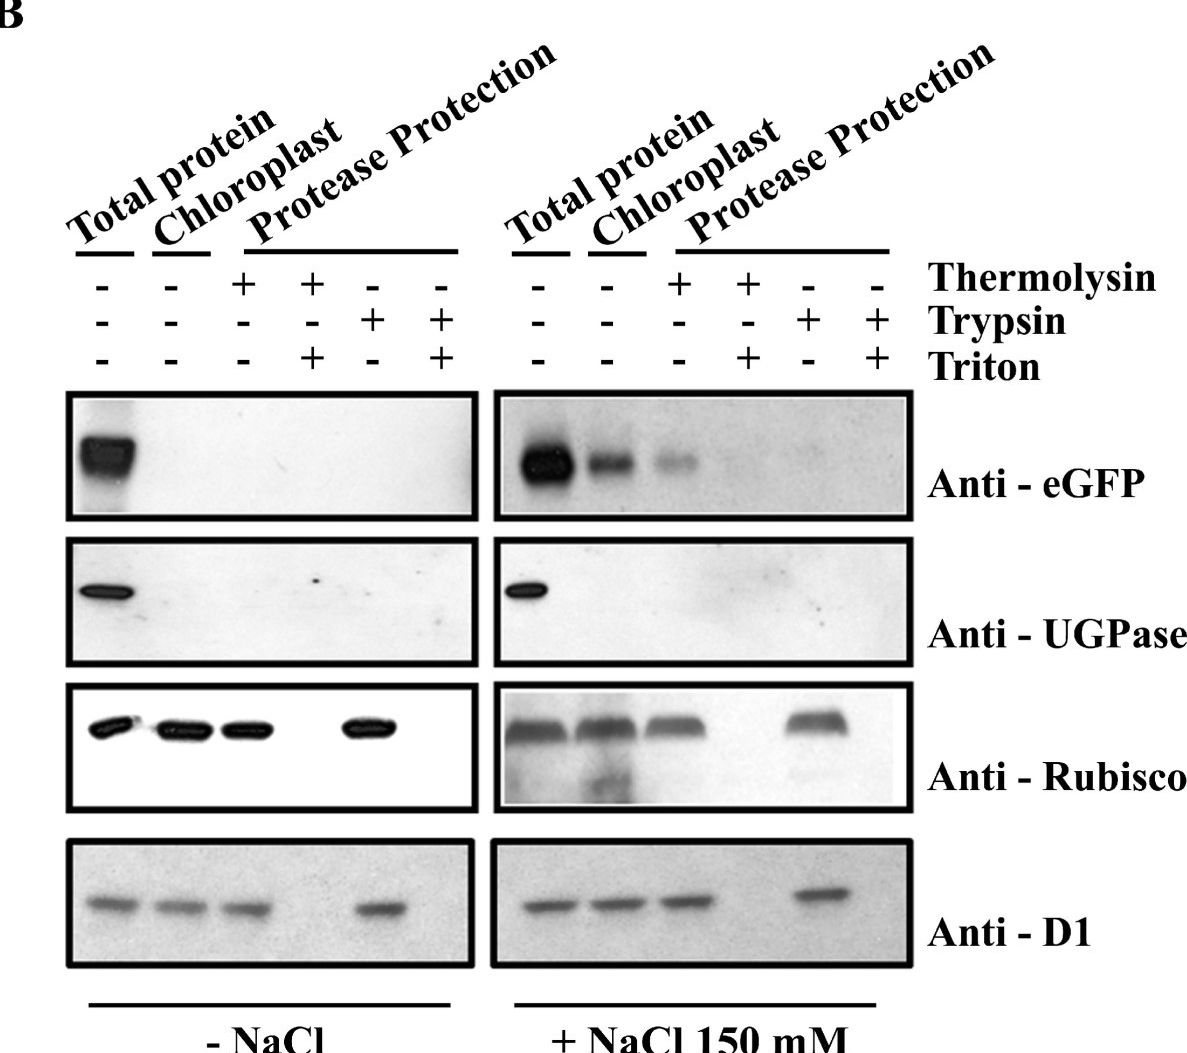
Reactant: Arabidopsis thaliana (Thale cress)
Application: Western Blotting
Pudmed ID: 21689410
Journal: BMC Plant Biol
Figure Number: 8B
Published Date: 2011-06-20
First Author: Balsemão-Pires, E., Jaillais, Y., et al.
Impact Factor: 4.142
Open PublicationAtTSPO accumulation and chloroplast localization upon salt stress. (A) Immunoblot analysis of OxAtTSPO:eGFP (OxM1TSPO:eGFP, OxM21TSPO:eGFP and OxM42TSPO:eGFP) fusion proteins detected in plants with an antibody to GFP. Plants were untreated, or treated with 150 mM NaCl. As a control wild-type plants and plants over-expressing GFP (OxeGFP) seedlings were used. (B) Anti-GFP immunoblot of trypsinized chloroplasts from Arabidopsis plants either untreated or treated with 150 mM NaCl. Control immunoblots were probed with antibodies chloroplast proteins RuBisCo and D1; and to cytosolic UGPase. Each lane represents equal amounts of chloroplasts.
Reactant: Nicotiana tabacum (Common tobacco)
Application: Western Blotting
Pudmed ID: 23227265
Journal: PLoS One
Figure Number: 4B
Published Date: 2012-12-12
First Author: Almoguera, C., Prieto-Dapena, P., et al.
Impact Factor: 2.942
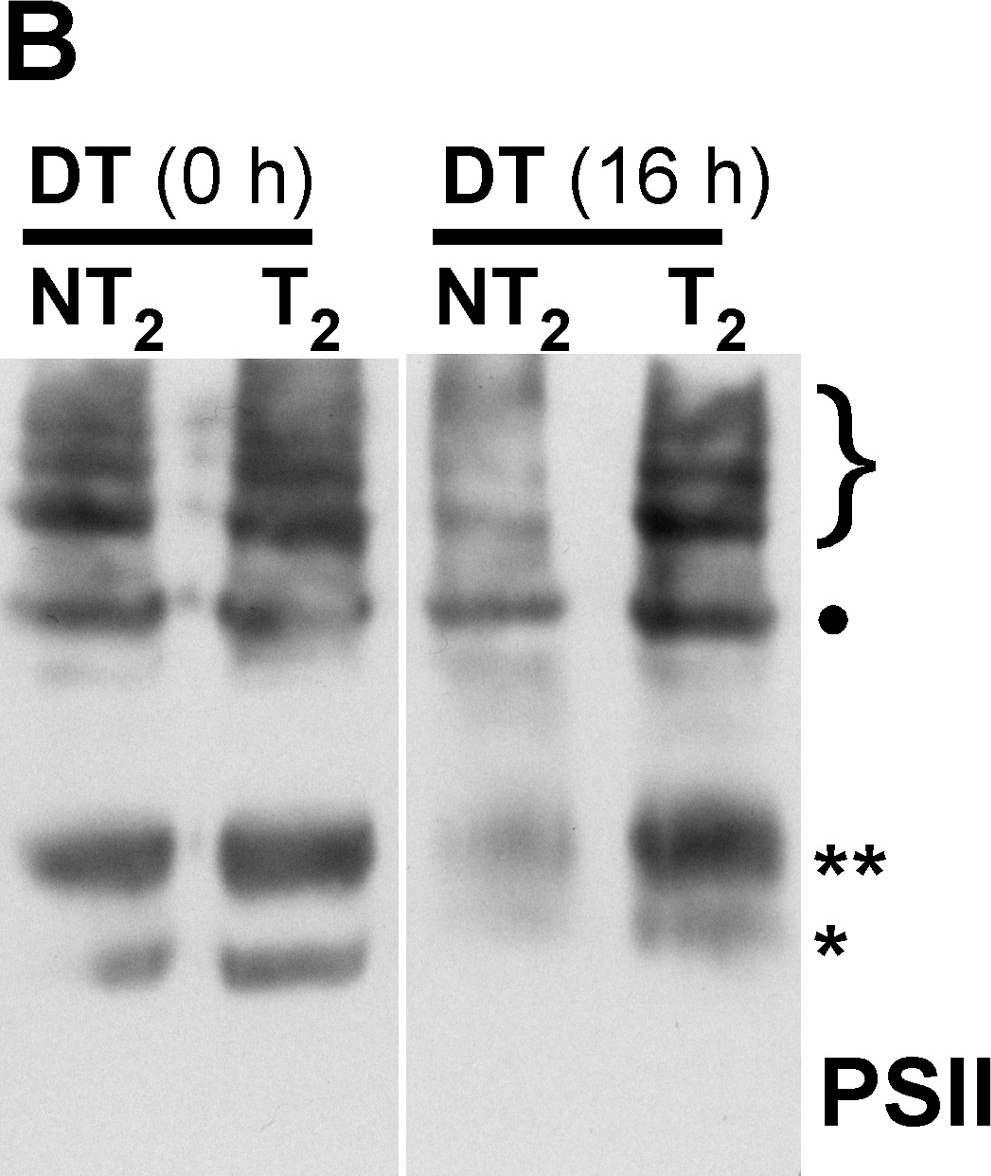
Open PublicationMembrane protein complexes of PSII and PSI survive in the 35S:A9 seedlings.(A) Western detection of complexes after the H2O2 treatments. The PSII complexes (top) separated by BN-PAGE were detected using anti-D1 (DE-loop) antibodies at 1/5,000 dilution. The PSI complexes (bottom) were detected using anti-PsaB antibodies at 1/4,000 dilution. PSII symbols: •, and the bracket on top respectively mark the dimeric PSII complex, and the PSII-LHCII super-complexes. The asterisk marks the CVII (CP43-less PSII monomer) complex. PSI symbols: • marks the PSI-LHCI super-complex that co-migrates in our gel system with the dimeric PSII complex; the asterisk marks the PSI monomer. (B) The PSII complexes also withstand drastic dehydration. The thylakoid samples were analyzed immediately (0 h) after the dehydration treatment (DT), and following rehydration for 16 h, DT (16 h). In this case the complexes were detected using anti-D1 (C-terminal) antibodies at 1/15,000 dilution. An additional PSII complex mentioned in the text is indicated: CV (**, PSII monomer).
Reactant: Phaeodactylum tricornutum
Application: Western Blotting
Pudmed ID: 28631733
Journal: Nat Commun
Figure Number: 2G
Published Date: 2017-06-20
First Author: Flori, S., Jouneau, P. H., et al.
Impact Factor: 13.783
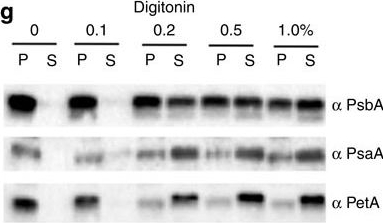
Open PublicationImmunolocalization of photosystems and of cyt b6f in the thylakoid membranes of P. tricornutum.(a–c) TEM images of P. tricornutum labelled with antibodies directed against the PsaA subunit of PSI (a), the PsbA subunit of PSII (b) and the PetA subunit of cyt b6f (c). (d) TEM micrograph of P. tricornutum thylakoid membranes showing four distinct areas: the internal membranes (‘core’: violet); the external, peripheral membranes (‘per.’: green); the pyrenoid (‘pyr.’: orange) and the envelope (‘env.’: magenta). Bars: 200?nm. (e) Principal component analysis of PSI, cyt b6f and PSII immunolocalization with the PsbA (solid squares), PsbC (open squares), PetA (cyan circle), PsaC (solid triangles) and PsaA (open triangles) antibodies. See also Supplementary Fig. 4. A total of 258 images from four independent cultures were analysed. The first two components represent more than 91% of the variance (see Supplementary Table 1, and Methods for a more detailed explanation). Green arrow: peripheral variable; violet arrow: core variable; orange arrow: pyrenoid variable; Magenta arrow: envelope variable. (f) 2D representation of the barycentre for the PSI (? PsaA+? PsaC antibodies, black square), cyt b6f (PetA, cyan circle) and PSII (? PsbA+? PsbC antibodies, red triangle) distributions. The point size along an axis is proportional to the s.d. along the corresponding component. (g) Solubilization of P. tricornutum thylakoid membranes with increasing concentrations of digitonin (0.1%, 0.2%, 0.5%, 1%). Pellet (P) and supernatant (S) were analysed by western blotting with the same anti PSI, PSII and cyt b6f antibodies as in a–c. Representative data set of an experiment replicated on three different biological samples.
Reactant: Arabidopsis thaliana (Thale cress)
Application: Western Blotting
Pudmed ID: 31240258
Journal: Commun Biol
Figure Number: 2A
Published Date: 2019-06-27
First Author: Pralon, T., Shanmugabalaji, V., et al.
Impact Factor: None
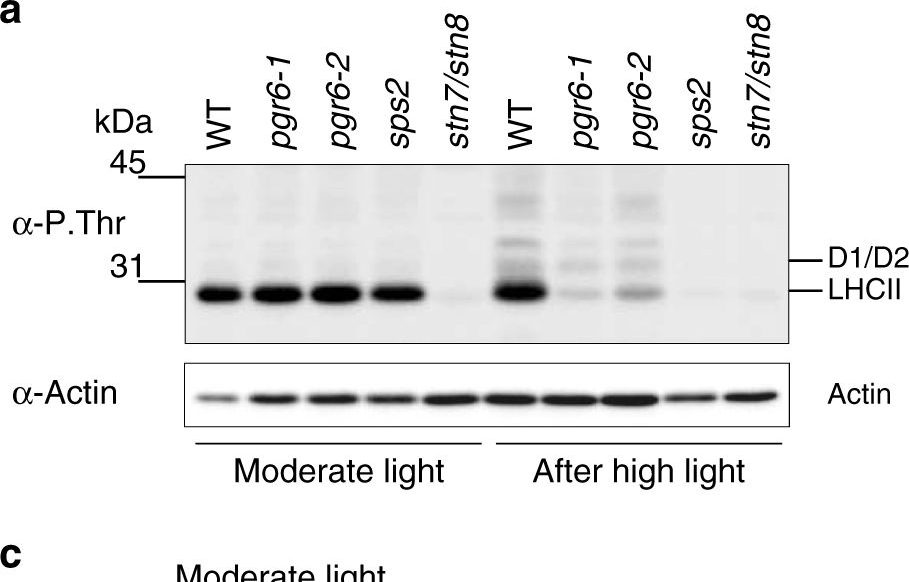
Open PublicationThylakoid protein phosphorylation and state transitions are disturbed after high light treatment in pgr6 background. a Total protein extracts of 4-week-old wild type (WT), pgr6-1, pgr6?2, sps2 and stn7/stn8 analysed by immunoblotting with anti-phosphothreonine antibody; the principal thylakoid phospho proteins are indicated on the right according to their size. Core photosystem II proteins D1 (PsbA) and D2 (PsbD) are indicated as a single band due to their poor resolution. Actin was used as a loading control. b Lhcb1 and Lhcb2 phosphorylation levels were visualised after separation on Phostag™-pendant acrylamide gels. The upper band corresponds to the phosphorylated form (p-), stn7/stn8 double mutant is a non-phosphorylated control. c Average transient of the variable room temperature chlorophyll fluorescence measured during the transition from red (660nm) supplemented with far-red light (720nm) state 1 to pure red light state 2 (n?=?4 independent pots containing 2–3 plants). The fluorescence curves from pgr6 and sps2 are shifted on the x-axis to allow visualising the FMST1 and FMST2 values. The x-axis time scale refers to the wild-type curve. d Calculated quenching related to state transition (qT?=?(FMST1?–?FMST2)/FM), expressed as the percentage of FM that is dissipated by the state 1 to state 2 transition, of wild type (WT), pgr6?1 and sps2 under moderate light (120?mol?m?2?s?1) (ML) and after 3?h of high light (500?mol?m?2?s?1) (HL). Whiskers and box plot shows the minimum, first quartile, median, average, third quartile and maximum of each dataset (n?=?4 biologically independent samples); p-values are calculated via a two-tailed Student’s t test. e STN7 phosphorylation level visualised after separation on Phostag™-pendant acrylamide gels. The upper band corresponds to the phosphorylated form (p-), a protein sample from stn7/stn8 double mutant was loaded as a control for the antibody specificity. Uncropped images of the membranes displayed in a, b and e are available as Supplementary Fig. 11. Data points for items c, d are available as Supplementary data 2
Reactant: Arabidopsis thaliana (Thale cress)
Application: Western Blotting
Pudmed ID: 31819921
Journal: Plant Direct
Figure Number: 4A
Published Date: 2019-11-01
First Author: Bethmann, S., Melzer, M., et al.
Impact Factor: None
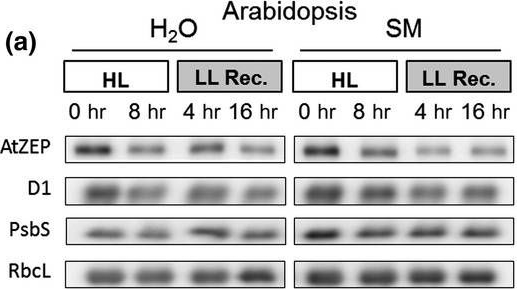
Open PublicationHigh light?induced changes of the D1 and ZEP protein content. Detached leaves of Arabidopsis (a), pea (b), spinach (c) and tobacco (d) plants were vacuum?infiltrated with H2O or 3 mM SM, as indicated in each panel. Leaves were exposed to HL for 8 hr at 2,000 µmol photons m?2 s?1 and 4°C and then transferred to LL (10–20 µmol photons m?2 s?1) for 16 hr. Total leaf protein extracts equivalent to 5 µg protein were separated by SDS?PAGE. The abundance of ZEP and D1 protein, as well as of the large subunit of RubisCO (RbcL) was assessed by immunoblotting with specific antibodies. Representative blots from at least 3 biological replicates are shown
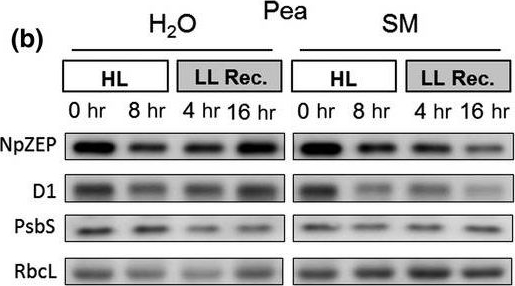
Reactant: Pisum sativum (Pea)
Application: Western Blotting
Pudmed ID: 31819921
Journal: Plant Direct
Figure Number: 4B
Published Date: 2019-11-01
First Author: Bethmann, S., Melzer, M., et al.
Impact Factor: None
Open PublicationHigh light?induced changes of the D1 and ZEP protein content. Detached leaves of Arabidopsis (a), pea (b), spinach (c) and tobacco (d) plants were vacuum?infiltrated with H2O or 3 mM SM, as indicated in each panel. Leaves were exposed to HL for 8 hr at 2,000 µmol photons m?2 s?1 and 4°C and then transferred to LL (10–20 µmol photons m?2 s?1) for 16 hr. Total leaf protein extracts equivalent to 5 µg protein were separated by SDS?PAGE. The abundance of ZEP and D1 protein, as well as of the large subunit of RubisCO (RbcL) was assessed by immunoblotting with specific antibodies. Representative blots from at least 3 biological replicates are shown
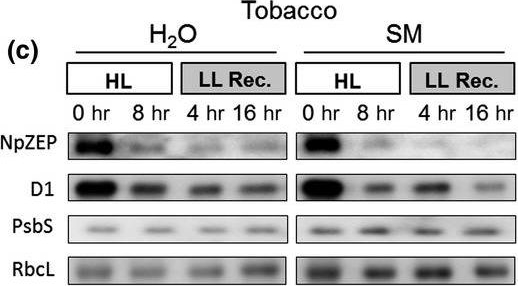
Reactant: Nicotiana tabacum (Common tobacco)
Application: Western Blotting
Pudmed ID: 31819921
Journal: Plant Direct
Figure Number: 4C
Published Date: 2019-11-01
First Author: Bethmann, S., Melzer, M., et al.
Impact Factor: None
Open PublicationHigh light?induced changes of the D1 and ZEP protein content. Detached leaves of Arabidopsis (a), pea (b), spinach (c) and tobacco (d) plants were vacuum?infiltrated with H2O or 3 mM SM, as indicated in each panel. Leaves were exposed to HL for 8 hr at 2,000 µmol photons m?2 s?1 and 4°C and then transferred to LL (10–20 µmol photons m?2 s?1) for 16 hr. Total leaf protein extracts equivalent to 5 µg protein were separated by SDS?PAGE. The abundance of ZEP and D1 protein, as well as of the large subunit of RubisCO (RbcL) was assessed by immunoblotting with specific antibodies. Representative blots from at least 3 biological replicates are shown
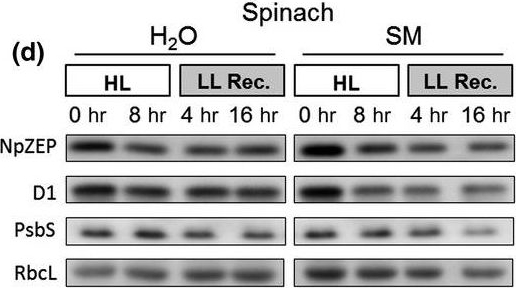
Reactant: Spinacia oleracea (Spinach)
Application: Western Blotting
Pudmed ID: 31819921
Journal: Plant Direct
Figure Number: 4D
Published Date: 2019-11-01
First Author: Bethmann, S., Melzer, M., et al.
Impact Factor: None
Open PublicationHigh light?induced changes of the D1 and ZEP protein content. Detached leaves of Arabidopsis (a), pea (b), spinach (c) and tobacco (d) plants were vacuum?infiltrated with H2O or 3 mM SM, as indicated in each panel. Leaves were exposed to HL for 8 hr at 2,000 µmol photons m?2 s?1 and 4°C and then transferred to LL (10–20 µmol photons m?2 s?1) for 16 hr. Total leaf protein extracts equivalent to 5 µg protein were separated by SDS?PAGE. The abundance of ZEP and D1 protein, as well as of the large subunit of RubisCO (RbcL) was assessed by immunoblotting with specific antibodies. Representative blots from at least 3 biological replicates are shown
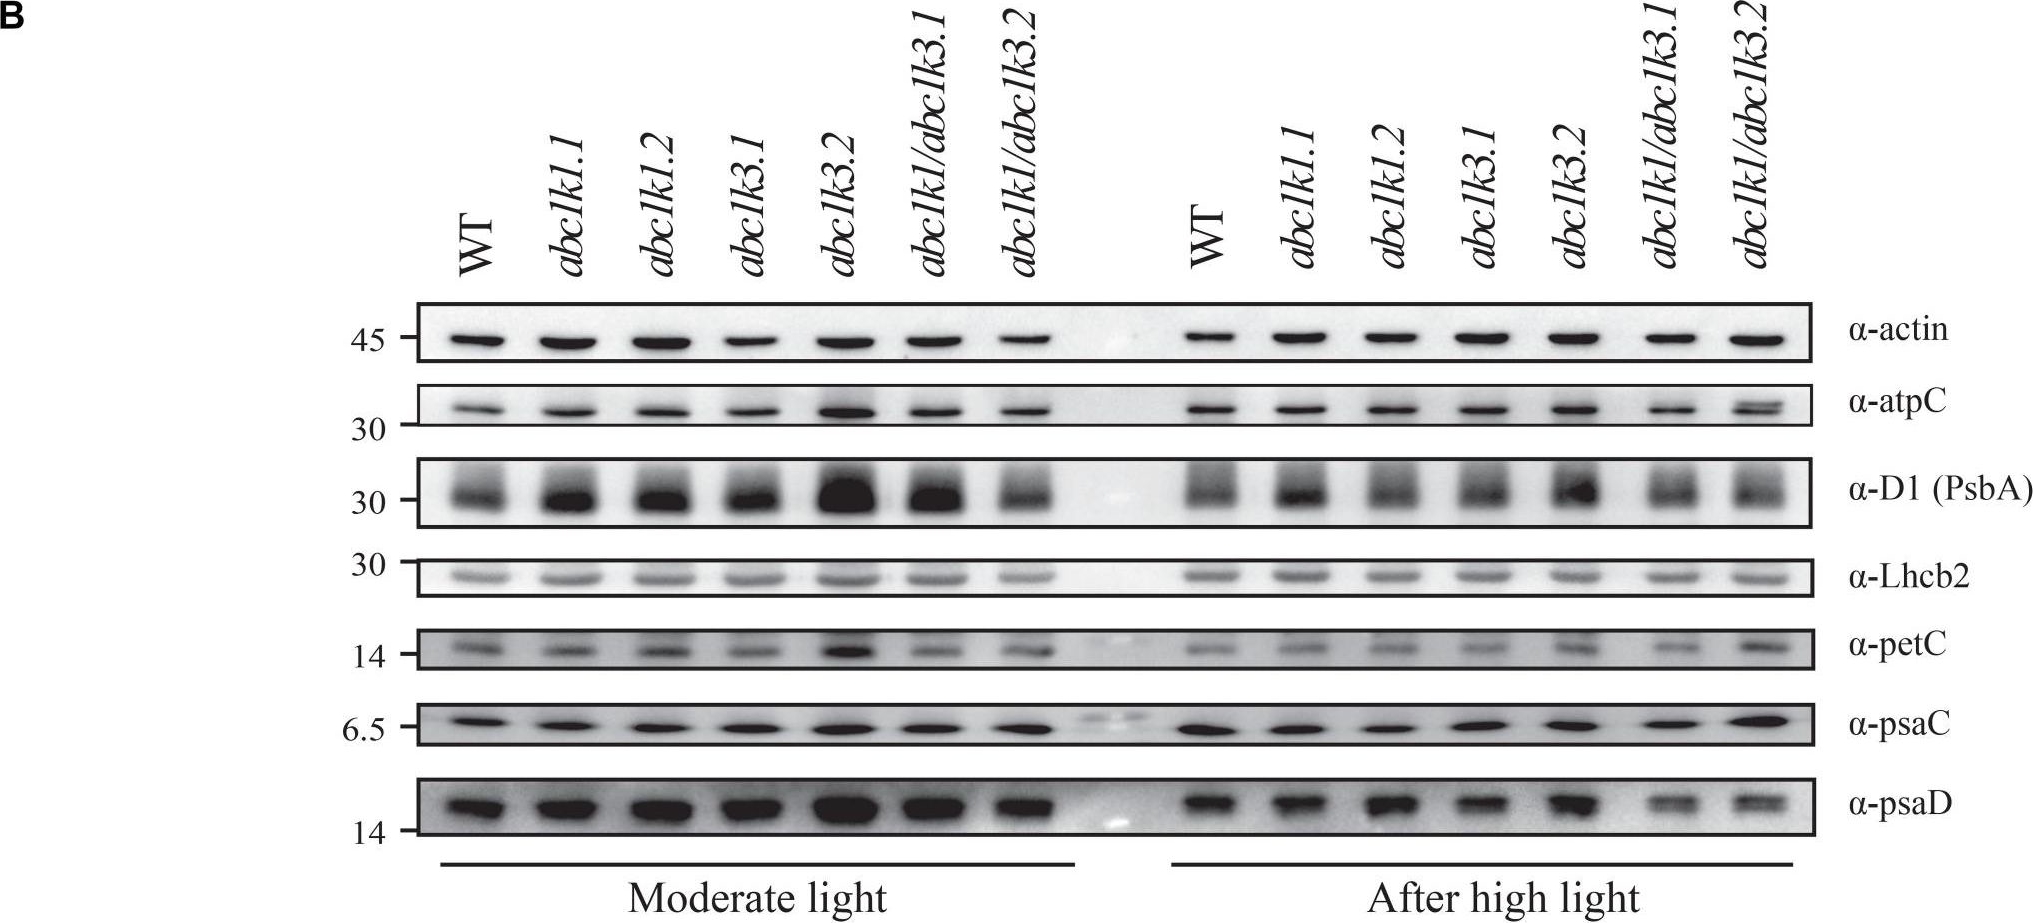
Reactant: Arabidopsis thaliana (Thale cress)
Application: Western Blotting
Pudmed ID: 32269582
Journal: Front Plant Sci
Figure Number: 7B
Published Date: 2020-04-10
First Author: Pralon, T., Collombat, J., et al.
Impact Factor: 5.435
Open PublicationDouble mutant maintains thylakoid protein phosphorylation and state transitions after high light. (A) Total protein extracts of wild type (WT), abc1k1.1, -2, abc1k3.1, -2, and abc1k1/abc1k3.1, -2 light-exposed leaves were separated by SDS PAGE, transferred on nitrocellulose membrane and decorated with anti-phosphothreonine antibody. The main thylakoid phospho-proteins are indicated on the right according to their size. Core photosystem II proteins D1 (PsbA) and D2 (PsbD) are indicated together due their poor resolution. (B) The accumulation of the principal photosynthetic complexes was assessed using antibodies against specific subunits of each complex: anti-Lhcb2 for the major LHCII, anti-D1 (PsbA) for PSII, anti-PetC for cytochrome b6f, anti-PsaD and anti-PsaC for PSI, and anti-AtpC for ATP synthase. Actin signal is shown as a loading control. (C) Fluorescence quenching related to the state transitions (qT) of wild type (WT), abc1k1.1, -2, abc1k3.1, -2, and abc1k1/abc1k3.1, -2 under moderate light (120 ?mol of photons m–2 s–1) (ML) and after 3 h of high light (500 ?mol of photons m–2 s–1) (HL). qT was calculated from the maximal chlorophyll fluorescence measured after 10 min exposure to red light (660 nm) supplemented with far-red illumination (720 nm) “State 1” (FMST1) or to pure red light “State 2” (FMST2). Quenching related to state transition was calculated as qT = (FMST1 – FMST2)/FM. Each value represents the average of a pot containing 2–3 plants. Superscript letters are used to indicate statistically different groups (p < 0.05) by paired Student’s t-test.
- Additional Information
-
Additional information: Due to biology of PsbA (D1) protein a number of degradation products can apprear in a sample and may be observed when using anti-PsbA antibodies, including products having apparent molecular weights of 24 kDa and 16 kDa. D1 degradation is a complex set of events and the products observed can be influenced by both the extraction procedure and the physiology of the cells prior to harvest. Third, cross-linking may occur between D1 and cytochrome b559, shifting the protein higher in the gel. In cyanobacteria (PCC7942), three different bands were competed out by preincubating the antibody with the PsbA free peptide, indicating that all bands are indeed PsbA and its precursors or breakdown products. Competition assays were also performed with spinach and Chlamydomonas, confirming the identity of PsbA bands.
Anti-PsbA antibodies will not detect D2 protein, as the peptide used to generate PsbA antibodies has no homology to the D2 sequence.
This product can be sold containing ProClin if requested.Additional information (application): The antibody is appropriate for detecting both, 24 kDa or the 10 kDa C-terminal fragments, whichever is generated under given treatment conditions. In our analysis we have seen both, ca. 24 kDa and ca. 10 kDa fragments from different samples, depending on treatments and isolation procedures.
Rabbit anti-PsbA antibody can detect more than one band of PsbA protein, e.g. precursor and mature protein as compare to the hen anti-PsbA antibodies AS01 016.
This antibody will detect the phosphorylated form of D1 as an alternate band to the main band on a high resolution gel.
The antibody will bind to cross-linked proteins: D1/D2, D1/cyt b559, D1/CP43.
The peptide is conserved in cyanobacterial D1:1 and D1;2. - Background
-
Background: The psbA gene has been cloned from many species of plants, green algae, and cyanobacteria. The psbA gene is located in the chloroplast genome and encodes for the D1 protein, a core component of Photosystem II. PsbA/D1 is rapidly cycled under illumination in all oxygenic photobionts. Tracking PsbA pools using the Global PsbA antibody can show the functional content of Photosystem II in a wide range of samples. Alternative names: 32 kDa thylakoid membrane protein, photosystem II protein D1
- Product Citations
-
Selected references: Ludwiczak et al. (2026). Photosystem I-independent oxygenic photosynthesis in cyanobacteria. Nat Commun . 2026 Jul 10;17(1):6081. doi: 10.1038/s41467-026-74903-2
Brandt et al. (2026). Plants tolerate substantial rates of plastid mistranslation via regulated proteostasis. Proc Natl Acad Sci U S A. 2026 Jun 2;123(22):e2537357123. doi: 10.1073/pnas.2537357123.
Liran et al. (2026). Compensatory respiration supports survival during extended heat stress in Microcystis aeruginosa. Sci Adv. 2026 Jun 5;12(23):eadz4338. doi: 10.1126/sciadv.adz4338.
Xing et al. (2026). Transplanting light-dependent reactions for mammalian eye photosynthesis. Cell . 2026 May 15:S0092-8674(26)00469-1. doi: 10.1016/j.cell.2026.04.034.
Bos et al. (2026). Expansion microscopy visualizes the photosystem distribution in Synechocystis cells. Biochim Biophys Acta Bioenerg. 2026 May 11;1867(4):149594. doi: 10.1016/j.bbabio.2026.149594.
Yi et al. (2026). The GreenCut protein TEF6 maintains photosystem II homeostasis under high light by stabilizing FtsH accumulation in Chlamydomonas reinhardtii. Plant Communications, 101709.
Koochak et al. (2026). How state transitions balance photosynthetic electron transport in plants – a quantitative study. New Phytol. 2026 Feb 10. doi: 10.1111/nph.70983.
Popova et al. (2025). Differential Photosynthetic Response of Tomato Plants—Ailsa Craig and Carotenoid Mutant tangerine—To Low Light Intensity and Low Temperature Treatment. Crops 2025, 5(6), 77; doi.org/10.3390/crops5060077
Zhong et al. (2025). Met246 and Asn250 in the D2 Protein are Essential for the Operation of the Quinone-Fe-Acceptor Complex of Photosystem II. Plant Cell Physiol. 2025 Jul 14:pcaf078. doi: 10.1093/pcp/pcaf078.
McKenzie and Puthiyaveetil (2025). Protein phosphorylation and oxidative protein modification promote plant photosystem II disassembly for repair. Plant Commun . 2025 Mar 10;6(3):101202. doi: 10.1016/j.xplc.2024.101202.
Huang et al. (2025). Nitrogen source type modulates heat stress response in coral symbiont (Cladocopium goreaui). Appl Environ Microbiol. 2025 Feb 19;91(2):e0059124. doi: 10.1128/aem.00591-24. Epub 2025 Jan 7.
Collombat et al. (2025). Arabidopsis conditional photosynthesis mutants abc1k1 and var2 accumulate partially processed thylakoid preproteins and are defective in chloroplast biogenesis. Commun Biol . 2025 Jan 22;8(1):111. doi: 10.1038/s42003-025-07497-y.
Pica et al. (2024). Functional ecological traits in young and adult thalli of canopy-forming brown macroalga Gongolaria barbata (Phaeophyta) from a transitional water system. PeerJ. 2024 Sep 12:12:e17959. doi: 10.7717/peerj.17959.
Salazar et al. (2024). SOS1 tonoplast neo-localization and the RGG protein SALTY are important in the extreme salinity tolerance of Salicornia bigelovii. Nat Commun. 2024 May 20;15(1):4279.doi: 10.1038/s41467-024-48595-5.
Phukan et al. (2024). Externally supplied ascorbic acid moderates detrimental effects of UV-C exposure in cyanobacteria. Photochem Photobiol Sci. 2024 Jul 12. doi: 10.1007/s43630-024-00612-8.
Zhao et al. (2024). Psb28 protein is indispensable for stable accumulation of PSII core complexes in Arabidopsis.Plant J. 2024 May 26. doi: 10.1111/tpj.16844.
Völkner et al. (2024). Evidence for partial functional overlap of KEA and MSL transport proteins in the chloroplast inner envelope of Arabidopsis thaliana. FEBS Lett. 2024 Aug;598(15):1877-1887. doi: 10.1002/1873-3468.14887.
Nuamzanei et al. (2024). Impact of polyvinyl chloride (PVC) microplastic on growth, photosynthesis and nutrient uptake of Solanum lycopersicum L. (Tomato). Environ Pollut. 2024 Apr 16:123994. doi: 10.1016/j.envpol.2024.123994.
Khaig and Eaton-Rye (2023).Lys264 of the D2 Protein Performs a Dual Role in Photosystem II Modifying Assembly and Electron Transfer through the Quinone–Iron Acceptor Complex. Biochemistry 2023, 62, 18, 2738–2750
Jiang et al. (2023). Toxic effects of lanthanum (III) on photosynthetic performance of rice seedlings: Combined chlorophyll fluorescence, chloroplast structure and thylakoid membrane protein assessment. Ecotoxicol Environ Saf. 2023 Nov 15:267:115627.doi: 10.1016/j.ecoenv.2023.115627.
Hyun et al. (2023). Functional demonstration of Aureochrome 1a proteasomal degradation after blue light incubation in the diatom Phaeodactylum tricornutum. J Plant Physiol. 2023 Dec 1:292:154148. doi: 10.1016/j.jplph.2023.154148
Rodrigues et al. (2023). Are tomato plants co-exposed to heat and salinity able to ensure a proper carbon metabolism?–An insight into the photosynthetic hub. Plant Physiol Biochem. 2023 Dec 10:206:108270.doi: 10.1016/j.plaphy.2023.108270.
Rredhi et al. (2023). The UV-A Receptor CRY-DASH1 Up- and Downregulates Proteins Involved in Different Plastidial Pathways. J Mol Biol. 2023 Sep 10:168271.doi: 10.1016/j.jmb.2023.168271.
Skalický et al. (2023). Fluorescence-activated multi-organelle mapping of subcellular plant hormone distribution. Plant J. 2023 Dec;116(6):1825-1841.doi: 10.1111/tpj.16456. Epub 2023 Sep 8.
Rogowski et al. (2023).Enzymatic kinetics of photosystem II with DCBQ as a substrate in extended Michaelis-Menten model. J Photochem Photobiol B. 2023 Oct:247:112780. doi: 10.1016/j.jphotobiol.2023.112780. Epub 2023 Aug 25.
Chen et al. (2023) Lysine 2-Hydroxyisobutyrylation- and Succinylation-Based Pathways Act Inside Chloroplasts to Modulate Plant Photosynthesis and Immunity
Chen et al. (2023) Variation of CRS2 Affected the Establishment of Photosynthetic System in Rice. Int J Mol Sci. 2023 Mar 18;24(6):5796. doi: 10.3390/ijms24065796
Wang et al. (2023) Regulation Mechanisms of Nitrogen-Doped Carbon Dots in Enhanced Maize Photosynthesis under Drought Stress, ACS Agricultural Science & Technology 2023 3 (2), 181-189, DOI: 10.1021/acsagscitech.2c00286
Harchouni et al. (2022) Guanosine tetraphosphate (ppGpp) accumulation inhibits chloroplast gene expression and promotes super grana formation in the moss Physcomitrium (Physcomitrella) patens. New Phytol. 2022;236(1):86-98. doi:10.1111/nph.18320
Naschberger, Mosebach, Tobiasson, et al. (2022) Algal photosystem I dimer and high-resolution model of PSI-plastocyanin complex. Nat Plants. 2022;8(10):1191-1201. doi:10.1038/s41477-022-01253-5
Miernicka et al. (2022) The Adjustment Strategy of Venus Flytrap Photosynthetic Apparatus to UV-A Radiation. Cells. 2022;11(19):3030. Published 2022 Sep 27. doi:10.3390/cells11193031
Espinoza-Corral & Lundquist. (2022) The plastoglobule-localized protein AtABC1K6 is a Mn2+-dependent kinase necessary for timely transition to reproductive growth. J Biol Chem. 2022 Apr;298(4):101762. doi: 10.1016/j.jbc.2022.101762. Epub 2022 Feb 22. PMID: 35202657; PMCID: PMC8956952.
Urban, Rogowski & Romanowska (2022), Crucial role of the PTOX and CET pathways in optimizing ATP synthesis in mesophyll chloroplasts of C3 and C4 plants, Environmental and Experimental Botany, Volume 202, October 2022, 105024.
Zang , Xu, Yan & Wu (2022). Elevated CO2 modulates the physiological responses of Thalassiosira pseudonana to ultraviolet radiation [published online ahead of print, 2022 Sep 22]. J Photochem Photobiol B. 2022;236:112572. doi:10.1016/j.jphotobiol.2022.112572
Torrado, Connabeer, Rottig, et al. (2022) Directing cyanobacterial photosynthesis in a cytochrome c oxidase mutant using a heterologous electron sink. Plant Physiol. 2022;189(4):2554-2566. doi:10.1093/plphys/kiac203
Ivanov et al. (2022) The decreased PG content of pgp1 inhibits PSI photochemistry and limits reaction center and light-harvesting polypeptide accumulation in response to cold acclimation. Planta 255, 36 (2022). https://doi.org/10.1007/s00425-022-03819-0
Byeon et al. (2022) Canopy height affects the allocation of photosynthetic carbon and nitrogen in two deciduous tree species under elevated CO2. J Plant Physiol. 2022 Jan;268:153584. doi: 10.1016/j.jplph.2021.153584. Epub 2021 Dec 2. PMID: 34890847.
Ye et al. (2022) Effect of increased CO2 on iron-light-CO2 co-limitation of growth in a marine diatom, ASLO, Limnol. Oceanogr. 2022, 172-176
Pavlovic & Kocab. (2021) Alternative oxidase (AOX) in the carnivorous pitcher plants of the genus Nepenthes: what is it good for? Ann Bot. 2021 Dec 18:mcab151. doi: 10.1093/aob/mcab151. Epub ahead of print. PMID: 34922341.
Cano-Ramirez et al. (2021) M. Plasma Membrane Fluidity: An Environment Thermal Detector in Plants. Cells. 2021 Oct 17;10(10):2778. doi: 10.3390/cells10102778. PMID: 34685758; PMCID: PMC8535034.
Cecchin et al (2021) LPA2 protein is involved in photosystem II assembly in Chlamydomonas reinhardtii. Plant J. 2021 Jul 4. doi: 10.1111/tpj.15405. Epub ahead of print. PMID: 34218480.
Mursalimov et al. (2021) Chlorophyll deficiency delays but does not prevent melanogenesis in barley seed melanoplasts. Protoplasma. https://doi.org/10.1007/s00709-021-01669-3 (Cryosections)
Chen, Liu & Liu (2021) Loss-Function of EGY1 Results in Photosynthesis Damage through Reducing Stability of Photosystem II in Arabidopsis thaliana. Russ J Plant Physiol (2021).
Gu et al. (2021) A Lipid Bodies-Associated Galactosyl Hydrolase Is Involved in Triacylglycerol Biosynthesis and Galactolipid Turnover in the Unicellular Green Alga Chlamydomonas reinhardtii
Sharma et al. (2021) Simultaneous knockout of multiple LHCF genes using single sgRNAs and engineering of a high-fidelity Cas9 for precise genome editing in marine algae. Plant Biotechnol J. 2021 Mar 24. doi: 10.1111/pbi.13582. Epub ahead of print. PMID: 33759354.
Pipitone et al. (2021). A multifaceted analysis reveals two distinct phases of chloroplast biogenesis during de-etiolation in Arabidopsis. Elife. 2021 Feb 25;10:e62709. doi: 10.7554/eLife.62709. PMID: 33629953; PMCID: PMC7906606.
Khajuria et al. (2020). Photochemical Efficiency Is Negatively Correlated With the Delta 9- Tetrahydrocannabinol Content in Cannabis Sativa L. Plant Physiol Biochem. 2020 Apr 8;151:589-600. doi: 10.1016/j.plaphy.2020.04.003.
Kurmayer et al. (2020). Chemically labeled toxins or bioactive peptides show a heterogeneous intracellular distribution and low spatial overlap with autofluorescence in bloom-forming cyanobacteria. Sci Rep. 2020 Feb 17;10(1):2781. doi: 10.1038/s41598-020-59381-w. (Immunofluorescence)
Their et al. (2020). VIPP2 interacts with VIPP1 and HSP22E/F at chloroplast membranes and modulates a retrograde signal for HSP22E/F gene expression. Plant Cell Environ. 2020 Jan 29. doi: 10.1111/pce.13732.
Levitan et al. (2019). Structural and functional analyses of photosystem II in the marine diatom Phaeodactylum tricornutum. Proc Natl Acad Sci U S A. 2019 Aug 27;116(35):17316-17322. doi: 10.1073/pnas.1906726116.
Rudenko et al. (2019). The role of carbonic anhydrase alfa-CA4 in the adaptive reactions of photosynthetic apparatus: the study with alfa-CA4 knockout plants. Protoplasma (2019).
Hu et al. (2019). Photoprotection capacity of microalgae improved by regulating the antenna size of light-harvesting complexes. J Appl Phycol (2019). doi.org/10.1007/s10811-019-01969-5
Zavrel et al. (2019). Quantitative insights into the cyanobacterial cell economy. Elife. 2019 Feb 4;8. pii: e42508. doi: 10.7554/eLife.42508.
Koh et al. (2019). Heterologous synthesis of chlorophyll b in Nannochloropsis salina enhances growth and lipid production by increasing photosynthetic efficiency. Biotechnol Biofuels. 2019 May 14;12:122. doi: 10.1186/s13068-019-1462-3. eCollection 2019.
An et al. (2019). Protein cross-interactions for efficient photosynthesis in the cassava cultivar SC205 relative to its wild species. J Agric Food Chem. 2019 Jul 19. doi: 10.1021/acs.jafc.9b00046.
Dogra et al. (2019). Oxidative post-translational modification of EXECUTER1 is required for singlet oxygen sensing in plastids. Nat Commun. 2019 Jun 27;10(1):2834. doi: 10.1038/s41467-019-10760-6.
Schober et al. (2019). Organelle Studies and Proteome Analyses on Mitochondria and Plastids Fractions from the Diatom Thalassiosira pseudonana. Plant Cell Physiol. 2019 Jun 10. pii: pcz097. doi: 10.1093/pcp/pcz097.
Lv et al. (2019). Uncoupled Expression of Nuclear and Plastid Photosynthesis-Associated Genes Contributes to Cell Death in a Lesion Mimic Mutant. Plant Cell. 2019 Jan;31(1):210-230. doi: 10.1105/tpc.18.00813.
Xu et al. (2019). Physiological response of the toxic and non-toxic strains of a bloom-forming cyanobacterium Microcystis aeruginosa to changing ultraviolet radiation regimes. Hydrobiologia (2019).
Giovanardi et al. (2018). In pea stipules a functional photosynthetic electron flow occurs despite a reduced dynamicity of LHCII association with photosystems. Biochim Biophys Acta. 2018 May 24. pii: S0005-2728(18)30129-4. doi: 10.1016/j.bbabio.2018.05.013.
Pao et al. (2018). Lamelloplasts and minichloroplasts in Begoniaceae: iridescence and photosynthetic functioning. J Plant Res. 2018 Mar 2. doi: 10.1007/s10265-018-1020-2. (ImmunoGold)
Muneer et al. (2018). Proteomic Analysis Reveals the Dynamic Role of Silicon in Alleviation of Hyperhydricity in Carnation Grown In Vitro. Int. J. Mol. Sci. 2018, 19(1), 50; doi:10.3390/ijms19010050.
Gao et al. (2018). Global warming interacts with ocean acidification to alter PSII function and protection in the diatom Thalassiosira weissflogii. Environmanetal and Exp. Bot. Volume 147, March 2018, Pages 95–103.
Ananyev et al. (2017). Photosystem II-Cyclic Electron Flow Powers Exceptional Photoprotection and Record Growth in the Microalga Chlorella ohadii.Biochim Biophys Acta. 2017 Jul 19. pii: S0005-2728(17)30105-6. doi: 10.1016/j.bbabio.2017.07.001.
Sharwood et al. (2017). Linking photosynthesis and leaf N allocation under future elevated CO2 and climate warming in Eucalyptus globulus. J Exp Bot. 2017 Feb 1;68(5):1157-1167. doi: 10.1093/jxb/erw484.
Míguez et al. (2017). Diversity of winter photoinhibitory responses: A case study in co-occurring lichens, mosses, herbs and woody plants from subalpine environments. Physiol Plant. 2017 Feb 14. doi: 10.1111/ppl.12551.
Romanowska et al. (2017). Differences in photosynthetic responses of NADP-ME type C4 species to high light. Planta. 2017 Mar;245(3):641-657. doi: 10.1007/s00425-016-2632-1. Epub 2016 Dec 18.
Yang-Er Chen et al. (2017). Responses of photosystem II and antioxidative systems to high light and high temperature co-stress in wheat. J. of Exp. Botany, Volume 135, March 2017, Pages 45–55.
Jin et al. (2023) Dual roles for CND1 in maintenance of nuclear and chloroplast genome stability in plants. Cell Rep. 2023 Mar 28;42(3):112268. doi: 10.1016/j.celrep.2023.112268. Epub 2023 Mar 17.
Mlinarić et el. (2021). Antioxidative response and photosynthetic regulatory mechanisms in common fig leaves after short‐term chilling stress. Ann Appl Biol. 2021; 1– 13.
Lan et al (2023) UPL5 modulates WHY2 protein distribution in a Kub-site dependent ubiquitination in response to [Ca2+]cyt-induced leaf senescence - Protocols
-
Agrisera Western Blot protocol and video tutorials
Protocols to work with plant and algal protein extracts
PsbA quantitation in plant and algal samples using Agrisera anti-PsbA antibody and PsbA protein standard
Methodology: Plant samples are generally ground with liquid nitrogen in a mortar and pestle. The resulting powder is transferred to a plastic tube. Algal samples can be either concentrated by centrifugation or, preferably, by filtration onto glass fiber filters. Solubilization is performed in Agrisera protein extraction buffer (PEB, AS08 300) containing 0.1mg/mL PefaBloc SC (AEBSF) protease inhibitor (Roche). Disruption is most optimally obtained through flash freezing of the sample in liquid nitrogen alternated with thawing by sonication with a microtip. This process can be repeated depending on the toughness of the sample. The sample is adjusted to 50 mM dithiothreitol and heated to 70°C for 5 minutes. Samples are cooled and centrifuged briefly prior to electrophoresis.
Optimal quantitation is achieved using moderate sample loads per gel lane, generally 0.5 to 2.5 ug total protein, depending on the abundance of the target protein.
Electrophoresis and Immunoblotting: Once solubilized, the proteins can be separated electrophoretically in a number of systems. We obtain optimal results with the Invitrogen NuPAGE gel system using Bis-Tris 4-12% gradient gels. Proteins are separated in MES SDS running buffer according to the manufacturer’s recommendations at 200 V for 35 minutes. The gels are transferred to PVDF in the same apparatus, the SureLock XCell blot module, for 60 minutes at 30 V for a single gel or 80 minutes for a pair. Following transfer the blots are blocked with non-fat dry milk up to 10 % in TBS-T, for 1 h/RT with gentle agitation. The blot is incubated with primary antibody, usually at 1:25 000 to 1:50 000, for 1 h/RT (if extreme femtogram detection reagents are used) or in lower primary antibody dilution for less sensitivie reagents (mid picogram and lower).
For quantitation a relatively high primary antibody: target protein ratio gives more reliable results than immunoblots at low ratios of primary antibody:target protein.
The blot is washed extensively in TBS-T (twice briefly, once for 15 minutes and three times for five minutes). The blot is incubated with secondary antibody, for example goat anti-rabbit IgG horse radish peroxidase conjugated, AS09 602 (Agrisera), for 1h/RT. The blot is washed as above and developed with ECL detection reagents.Quantitation: When quantitated standards are included on the blot, the samples can be quantitated using the available software. Excellent quantitation can be obtained with images captured on the Bio-Rad Fluor-S-Max or equivalent instrument using Bio-Rad QuantityOne software. The contour tool is used to select the area for quantitation and the values are background subtracted to give an adjusted volume in counts for each standard and sample. Using above protocol linear standard curves are generated over 1-1.5 orders of magnitude range in target load. It is important to note that immunodetections usually show a strongly sigmoidal signal to load response curve, with a region of trace detection of low loads, a pseudolinear range and a region of saturated response with high loads. For immunoquantitation it is critical that the target proteins in the samples and the standard curve fall within the pseudolinear range. Our total detection range using this protocol spans over 2 orders of magnitude, but the quantifiable range is narrower.
Application example
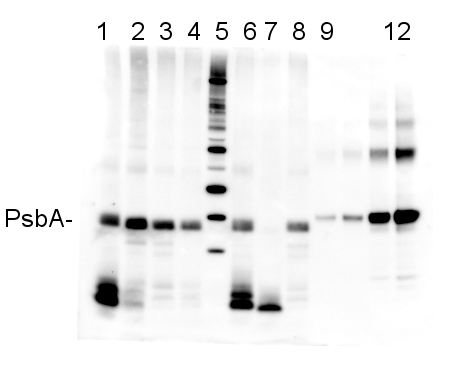
2 µg of total protein from (1-4 and 6-8) Prochlorococcus sp. extracted with Protein Extration Buffer, PEB (AS08 300), (9-12) PsbA protein standard (AS01 016S), (5) molecular weight markers (Magic Marks, Invitrogen) were separated on 4-12% NuPage (Invitrogen) LDS-PAGE and blotted 1h to PVDF. Blots were blocked immediately following transfer in 2% blocking reagent in Tween-20 (TBS-T) for 1h/RT with agitation. Blots were incubated in the primary antibody at a dilution of 1: 50 000 for 1h/RT with agitation. The antibody solution was decanted and the blot was rinsed briefly twice, then washed once for 15 min and 3 times for 5 min in TBS-T at room temperature with agitation. Blots were incubated in secondary antibody (anti-rabbit IgG horse radish peroxidase conjugated) diluted to 1:10 000 in for 1h/RT with agitation. The blots were washed as above and developed for 5 min with ECL detection reagent according the manufacturers instructions. Images of the blots were obtained using a CCD imager (FluorSMax, Bio-Rad) and Quantity One software (Bio-Rad). The nati Various smaller C-terminal cleavage products from PsbA are evident in the Prochlorococcus samples; these are real, and vary in reprocible ways depending on treatment and growth conditions.
Recommended secondary antibodies: goat anti-rabbit HRP conjugated, goat anti-rabbit ALP conjugated
Recommended chemiluminescent detection reagent: AgriseraECLBright
References:MacKenzie et al (2005). Large reallocations of carbon, nitrogen and photosynthetic reductant among phycobilisomes, photosystems and Rubisco during light acclimation in Synechococcus elongatus are constrained in cells under low environmental inorganic carbon. Arch of Microbiol. 183: 190 - 202.
Bouchard et al. (2006) UVB effects on the photosystem II-D1 protein of phytoplankton and natural phytoplankton communities. Photochem and Photobiol 82: 936-951. - Reviews:
-
Ermenegilda Vitale | 2025-06-23We have tested this antibody on the macroalgae Gongolaria barbata and Ellisolandia elongata, using a dilution of 1:15.000. It performed effectively across all species tested, showing excellent cross-reactivity and versatility. Overall, I am highly pleased with this antibody from Agrisera. It delivers consistent and reproducible results, making it a valuable resource for investigating photosynthetic protein dynamics under diverse conditions.Justus Niemeyer | 2020-09-15This antibody worked very well for Chlamydomonas reinhardtii. We used it for immunoblot and loaded 5-10 µg total protein. Dilution of 1:10000 for 1h is sufficient. We are satisfied and would buy again!Soo Yeon Ko | 2019-11-18This antibody is also good for
Oryza Sativa. The samples were treated in light stress, and we could see the D1 band. We used 1:10000
dillution.Katya Georgieva | 2019-06-24We used the antibody to detect the protein changes of D1during desiccation of Haberlea rhodopensis plants. PsbA worked well on thylakoid proteins (3ug chlorophyll per lane, 1:20000 dilution of PsbA, ECL detection of WB). The antibody gave 2 bands due to cross-reaction with cytochrome b559.
Reference: Mihailova G, Büchel C, Dietzel L, Georgieva K (2016) Desiccation induced changes in photosynthesis related proteins of shade and sun Haberlea rhodopensis plants. Compt. Rend Bulg. Acad. Sci. 69(1), 37-44| 2016-07-26This antibody worked fine for Arabidopsis grown in medium light, giving a band of expected size, but broad. After stress treatment, lower molecular mass degradation product was also detected. We used 1:10 000 dillution for 1h.| 2014-12-20This antibody worked very well on whole cell extracts of Phaeodactylum tricornutum. Here is the detailed protocol we followed:4 µg of total protein from Phaeodactylum tricornutum were loaded on a 13% SDS-PAGE and blotted 1.5 h to nitrocellulose. Blots were blocked immediately following transfer in 5% milk-TBS-T for 1h at room temperature with agitation. Blots were incubated in the primary antibody at a dilution of 1:10000 overnight at 4 oC with agitation. The antibody solution was decanted and the blot was rinsed briefly, then washed 3 times for 5 min in TBS-T at room temperature with agitation. Blots were incubated in secondary antibody (anti-rabbit IgG horse radish peroxidase conjugated) diluted to 1:10 000 in TBS-T for 1h at room temperature with agitation. The blots were washed as above and developed 6 sec with ECL detection reagent. Images of the blots were obtained using a CCD imager (Chemidock MP Imaging, Bio-Rad).Katarzyna Hura | 2013-10-30This antibody works well. We have tried this antibody on wheat and barley. I have been using recommended dilution 1:20 000.Sujith Puthiyaveetil | 2013-08-19This antibody works well. It gives clean results. I usually get a strong band around 30 kDa. Sometimes, this 30 kDa band is shifted down a little bit (around 28 kDa). In response to photoinhibition, one could also see bands around 55-60 kDa, in addition to the 28 kDa band. This could be the aggregated or cross-linked D1, as other reviewers suggest. Other than Arabidopsis, we have tried this antibody on rice, wheat, Arundo, Craterostigma, and Lindernia, and we can report that it works for all of them. Overall, I am satisfied with this antibody from Agrisera.Miroslava | 2012-09-18This antibody has been working well It always gave me strong signal above 30 kDa with normally grown Arabidopsis. After high light treatment, there were two additional bands, less intense one above 60 kDa (D1 aggregate) and faint one @ 25kDa (degradation product). I have been using recommended dilution 1:10000. We were satisfied with this antibody.Shizue Matsubara | 2012-04-04This antibody gave 2 bands - a clear band at 34 kDa and a faint band at 24 kDa - with low light-grown Arabidopsis leaf protein extracts.Elzbieta Romanowska | 2009-06-30This antibody has been working well on Panisum miliaceum,Panicum maximum, Zea mays and Pisum sativum. We are satisfied.Sergio González-Pérez | 2009-04-21We have used this antibody for western blot detection of D1 in Arabidopsis cell cultures and spinach reaction centres. Just mention that we got a very well defined and clear signal even at low dilution (1:20000). It allows a precise quantification.
Related products
AS01 016S | Positive control/quantitation standard, for use in Western blot.
AS09 602 | Clonality: Polyclonal | Host: Goat | Reactivity: Rabbit IgG (H&L)
AS13 2669 | Clonality: Polyclonal | Host: Rabbit | Reactivity: [global antibody] for higher plants
Benefits of using this antibody