1
Anti-PsbD | D2 protein of PSII
AS06 146 | Clonality: Polyclonal | Host: Rabbit | Reactivity: [global antibody] for A. thaliana, Anabaena 7120, D. brightwellii, H. vulgare, C.reinhardtii, C. zofingiensis, L. corniculatus, N. tabacum, O. sativa, P. sativum, P. vulgaris, P. tricornutum, T. pratense, S. alba, Synechococcus sp. PCC 7942, Synechocystis sp. PCC6803, T. guillardii, T. pseudonana, Triticale, U. prolifera, Z. mays
Benefits of using this antibody
- Product Info
-
Immunogen: KLH-comjugated synthetic peptide derived from the C-terminal of known PsbD sequences including Arabidopsis thaliana P56761, Hordeum vulgare P11849, Chlamydomonas reinhardtii P06007, Synechococcus sp. PCC 7002 P20898
Host: Rabbit Clonality: Polyclonal Purity: Serum Format: Lyophilized Quantity: 50 µl Reconstitution: For reconstitution add 50 µl of sterile water Storage: Store lyophilized/reconstituted at -20°C; once reconstituted make aliquots to avoid repeated freeze-thaw cycles. Please remember to spin the tubes briefly prior to opening them to avoid any losses that might occur from material adhering to the cap or sides of the tube. Tested applications: Clear-native PAGE (CN-PAGE), Western blot (WB) Recommended dilution: 1: 10 000 (CN-PAGE), 1: 5000 - 1 : 50 000 (WB) Expected | apparent MW: 39.4 | 28-30 kDa - Reactivity
-
Confirmed reactivity: Arabidopsis thaliana, Anabaena 7120, Ditylum brightwellii, Horderum vulgare, Chlamydomonas reinhardtii, Chromochloris zofingiensis, Echinola crus-galli, Emiliania huxleyi, Lotus corniculatus, Nicotiana tabacum, Oryza sativa, picocyanobacteria, Pisum sativum, Phaseolus vulgaris, Phaeodactylum tricornutum, Trifolium pratense, Skeletonema costatum (diatom), Sinapsis alba, Synechococcus sp. PCC 7942, Synechocystis sp. PCC6803, Thalassiosira guillardii, Thalassiosira pseudonana, Triticale, Ulva prolifera, Zea mays
Predicted reactivity: Aegilops tauschii, Brassica napus, Cannabis sativa, Capsicum annuum, Centrolepsis monogyna, Chromera velia, Crocosphaera watsonii, Cyanidioschyzon merolae, Fischerella sp., Galdieria sulphuraria,Glycine max, Glycine soja, Leiosporoceros dussii, Cucumis sativa, Manihot esculenta, Marchantia polymorpha, Microcystis aeruginosa, Nannochloropsis, Panax ginseng, Petermannia cirrosa, Pinus thunbergii, Physcomitrium patens, Pinus strobus, Populus trichocarpa, Ricinus communis, Solanum tuberosum, Spinacia oleracea, Solanum lycopersicum. Triticum aestivum, Utricularia alpina, Vitis vinifera, Vitrella brassicaformis
Species of your interest not listed? Contact usNot reactive in: No confirmed exceptions from predicted reactivity are currently known - Application Examples
-

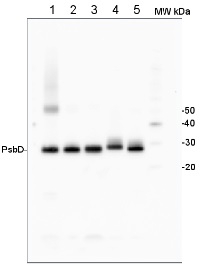
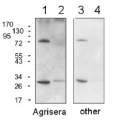
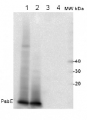
2 µg of total protein from (1) Arabidopsis thaliana leaf extracted with Agrisera Protein Extraction Buffer, PEB (AS08 300), (2) Hordeum vulgare leaf extracted with PEB, (3) Chlamydomonas reinhardtii total cell extracted with PEB, (4) Synechococcus sp. 7942 total cell extracted with PEB, (5) Anabaena sp. total cell extracted with PEB were separated on 4-12% NuPage (Invitrogen) LDS-PAGE and blotted 1h to PVDF. Blots were blocked immediately following transfer in 2% blocking reagent in 20 mM Tris, 137 mM sodium chloride pH 7.6 with 0.1% (v/v) Tween-20 (TBS-T) for 1h at room temperature with agitation. Blots were incubated in the primary antibody at a dilution of 1: 50 000 for 1 h/RT with agitation. The antibody solution was decanted and the blot was rinsed briefly twice, then washed once for 15 min and 3 times for 5 min in TBS-T at room temperature with agitation. Blots were incubated in secondary antibody (anti-rabbit IgG horse radish peroxidase conjugated, recommended secondary antibody AS09 602) diluted to 1:50 000 in 2% blocking solution for 1h at room temperature with agitation. The blots were washed as above and developed for 5 min with chemiluminescent detection reagent according the manufacturers instructions. Images of the blots were obtained using a CCD imager (FluorSMax, Bio-Rad) and Quantity One software (Bio-Rad).
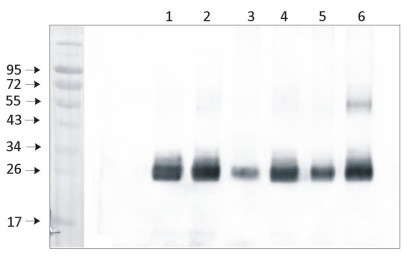
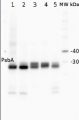
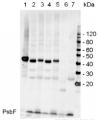
1 μg of chlorophyll from Pisum sativum (1), Zea mays, mesophyll (2) and bundle sheath (3), Echinochloa crus-galli, mesophyll (4) and bundle sheath (5), Arabidopsis thaliana (6) chloroplasts extracted with 0.4 M sorbitol, 50 mM Hepes NaOH, pH 7.8, 10 mM NaCl, 5 mM MgCl 2 and 2 mM EDTA were loaded to lanes. Samples were denatured with Laemmli buffer at 75°C for 5 min and were separated on 12% SDS-PAGE, and blotted 30 min to PVDF using wet transfer. Blot was blocked with 5% milk for 2h at room temperature (RT) with agitation. Blot was incubated in the primary antibody Anti-PsbD at a dilution of 1: 5000 in 1% milk in TBS-T overnight at 4°C with agitation. The antibody solution was decanted and the blot was washed 4 times for 5 min in TBS-T at RT with agitation. Blot was incubated in secondary antibody (anti-rabbit IgG HRP conjugated, from Agrisera, AS09 602) diluted to 1:20 000 in 1 % milk in TBS-T for 1h at RT with agitation. The blot was washed 5 times for 5 min in TBS-T and 2 times for 5 min in TBS, and developed for 1 min with 1.25 mM luminol, 0.198 mM coumaric acid and 0.009% H 2 O 2 in 0.1 M Tris- HCl, pH 8.5. Exposure time in ChemiDoc System was 14 seconds.
Courtesy of Dr. Wioleta Wasilewska-Dębowska, University of Warsaw, Poland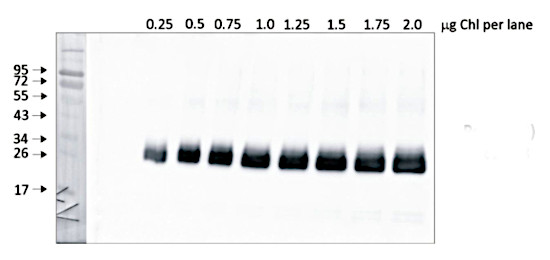
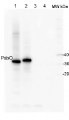
Quantity control of chlorophyll amount loading onto gel. From 0,25 μg to 2,0 μg of chlorophyll from Pisum sativum chloroplasts were loaded to lanes. All steps of experiments were the same as described above.
Courtesy of Dr. Wioleta Wasilewska-Dębowska, University of Warsaw, PolandApplication examples: 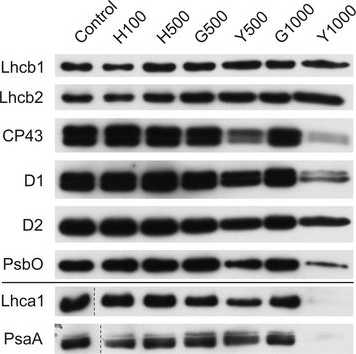
Reactant: Plant
Application: Western Blotting
Pudmed ID: 27590049
Journal: BMC Plant Biol
Figure Number: 9A
Published Date: 2016-09-02
First Author: Mazur, R., Sadowska, M., et al.
Impact Factor: 4.142
Open PublicationChanges of PSII and PSI antenna and core protein levels. Proteins from control and Tl-treated white mustard leaves were separated by SDS-PAGE followed by immunodetection with antibodies against Lhcb1, Lhcb2, Lhca1 (antenna proteins) and D1, D2, CP43, PsbO, PsaA (core proteins). Samples were loaded on the equal amount of chlorophyll (0.25 ?g). Description of samples abbreviation as given in the legend to Fig. 3
Reactant: Chlamydomonas reinhardtii (Green Alga)
Application: Western Blotting
Pudmed ID: 28466860
Journal: Nat Commun
Figure Number: 5A
Published Date: 2017-05-03
First Author: Fu, H. Y., Picot, D., et al.
Impact Factor: 13.783
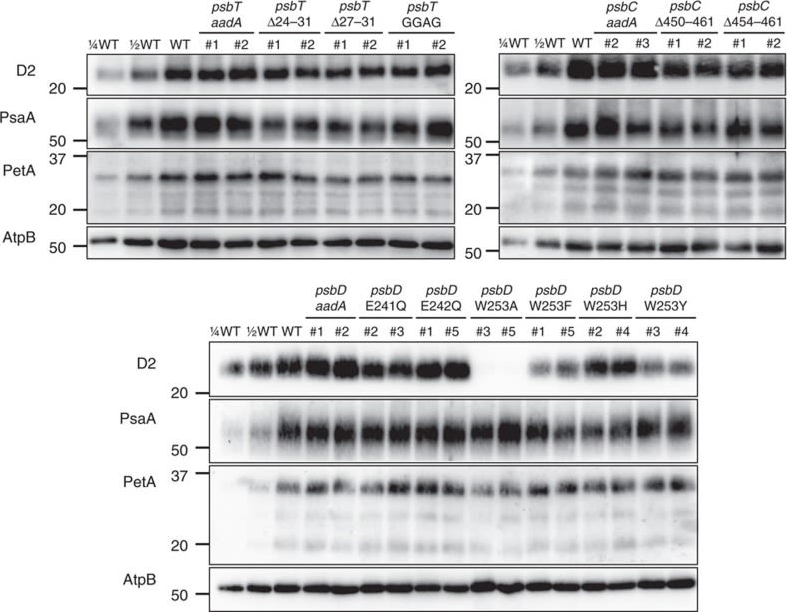
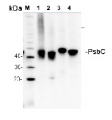
Open PublicationAccumulation of photosynthetic complexes in the mutant strains.Cells were grown in TAP medium at 25?°C under LED white light (8??mol photons m?2?s?1) and collected at the mid-log phase. Two independent lines are shown for each construct. Protein samples were loaded on an equal chlorophyll basis (0.5??g per lane), and a dilution series of WT samples is shown for semi-quantitative comparison. Antibodies against essential subunits of PSII (D2), PSI (PsaA), cytochrome b6f (PetA) and ATP synthase (AtpB) probed the accumulation of the respective photosynthetic complexes. Numbers on the left side of the blots are molecular weights in kD. See Supplementary Fig. 9 for the uncropped blot images.
Reactant: Arabidopsis thaliana (Thale cress)
Application: Western Blotting
Pudmed ID: 31240258
Journal: Commun Biol
Figure Number: 2A
Published Date: 2019-06-27
First Author: Pralon, T., Shanmugabalaji, V., et al.
Impact Factor: None
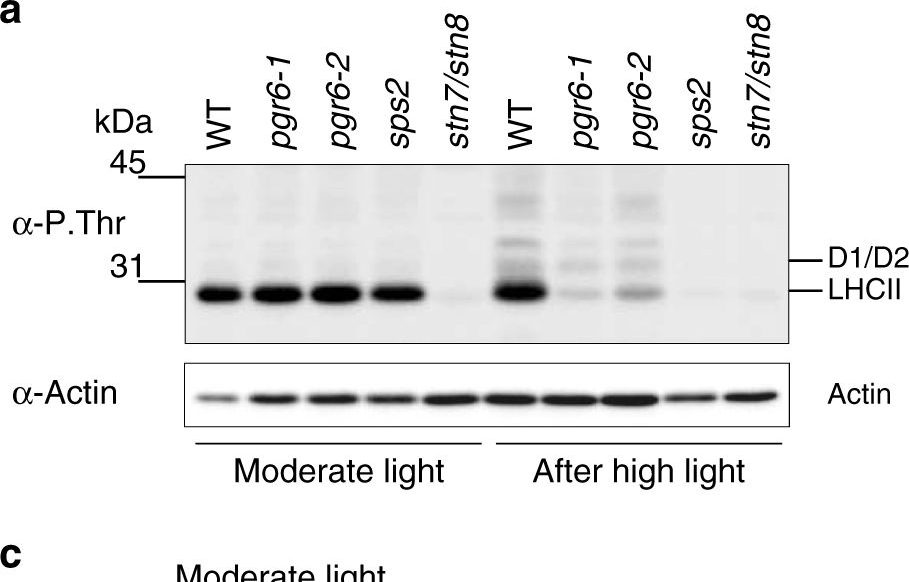
Open PublicationThylakoid protein phosphorylation and state transitions are disturbed after high light treatment in pgr6 background. a Total protein extracts of 4-week-old wild type (WT), pgr6-1, pgr6?2, sps2 and stn7/stn8 analysed by immunoblotting with anti-phosphothreonine antibody; the principal thylakoid phospho proteins are indicated on the right according to their size. Core photosystem II proteins D1 (PsbA) and D2 (PsbD) are indicated as a single band due to their poor resolution. Actin was used as a loading control. b Lhcb1 and Lhcb2 phosphorylation levels were visualised after separation on Phostag™-pendant acrylamide gels. The upper band corresponds to the phosphorylated form (p-), stn7/stn8 double mutant is a non-phosphorylated control. c Average transient of the variable room temperature chlorophyll fluorescence measured during the transition from red (660nm) supplemented with far-red light (720nm) state 1 to pure red light state 2 (n?=?4 independent pots containing 2–3 plants). The fluorescence curves from pgr6 and sps2 are shifted on the x-axis to allow visualising the FMST1 and FMST2 values. The x-axis time scale refers to the wild-type curve. d Calculated quenching related to state transition (qT?=?(FMST1?–?FMST2)/FM), expressed as the percentage of FM that is dissipated by the state 1 to state 2 transition, of wild type (WT), pgr6?1 and sps2 under moderate light (120?mol?m?2?s?1) (ML) and after 3?h of high light (500?mol?m?2?s?1) (HL). Whiskers and box plot shows the minimum, first quartile, median, average, third quartile and maximum of each dataset (n?=?4 biologically independent samples); p-values are calculated via a two-tailed Student’s t test. e STN7 phosphorylation level visualised after separation on Phostag™-pendant acrylamide gels. The upper band corresponds to the phosphorylated form (p-), a protein sample from stn7/stn8 double mutant was loaded as a control for the antibody specificity. Uncropped images of the membranes displayed in a, b and e are available as Supplementary Fig. 11. Data points for items c, d are available as Supplementary data 2
Reactant: Arabidopsis thaliana (Thale cress)
Application: Western Blotting
Pudmed ID: 32963291
Journal: Sci Rep
Figure Number: 3C
Published Date: 2020-09-22
First Author: Wang, L., Leister, D., et al.
Impact Factor: 4.13
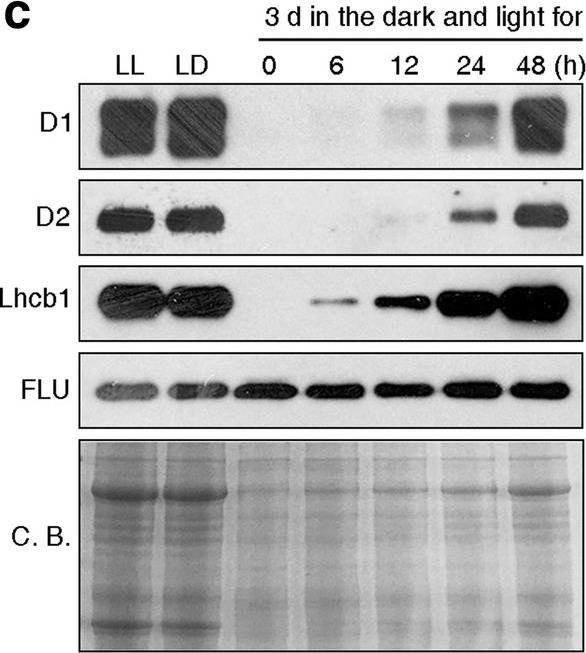
Open PublicationPhotomorphogenesis is not significantly affected in ros1, nrpd1, nrpe1, rdr2 or ago4 mutant seedlings. (a) Phenotypes (upper panel) and the corresponding maximum quantum yields of PSII (Fv/Fm) (lower panel) of 4-day-old etiolated seedlings. Fv/Fm was measured with an imaging Chl fluorometer (Imaging PAM). Scale bar?=?1 cm. (b) Phenotypes (upper panel) and corresponding Fv/Fm values (lower panel) of 3-day-old etiolated seedlings which had been exposed to continuous light for 24 h. (c) Immunoblot analysis of the PSII core proteins (D1 and D2), Lhcb1 and FLU during greening of etiolated seedlings. WT seedlings were grown for 3 days in the dark and exposed to light for between 0 and 48 h, as indicated. Extracted total proteins were normalized with respect to fresh weight and fractionated by SDS-PAGE. Blots were then probed with antibodies raised against the individual proteins. Total proteins from 5-day-old WT seedlings grown under continuous light (LL) and LD conditions (LD) were used as positive controls. The total protein accumulation of each sample was visualized by staining the gel with Coomassie Blue R250 (C.B.). The figure was assembled from different blots (delineated by a black rectangle) and full-length blots are presented in Supplementary Fig. S7. (d) Immunoblot analysis of representative photosynthesis proteins of 3-day-old etiolated mutant seedlings which had been exposed to continuous light for 24 h. Immunoblot analysis was performed as in (c). The figure was assembled from different blots (delineated by a black rectangle) and full-length blots are presented in Supplementary Fig. S8. (e) Real-time PCR analyses of 3-day-old etiolated WT (Col-0) and mutant seedlings that had been exposed to continuous light for 24 h. Real-time PCR was performed with primers specific for the nuclear genes LHCB1.2, LHCB2.1, LHCB6, LHCA5, PSBP-1 and PSBTn, and the plastid genes psaA and atpB. Note that the primers for LHCB2.1 also amplify LHCB2.2 mRNA. Expression values are reported relative to the corresponding transcript levels in the WT and were normalized with respect to the expression level of ACTIN2. Data are shown as mean values?±?SD from three different plant pools.
Reactant: Arabidopsis thaliana (Thale cress)
Application: Western Blotting
Pudmed ID: 33322466
Journal: Biomolecules
Figure Number: 7A
Published Date: 2020-12-11
First Author: Andreeva, A. A., Vankova, R., et al.
Impact Factor: None
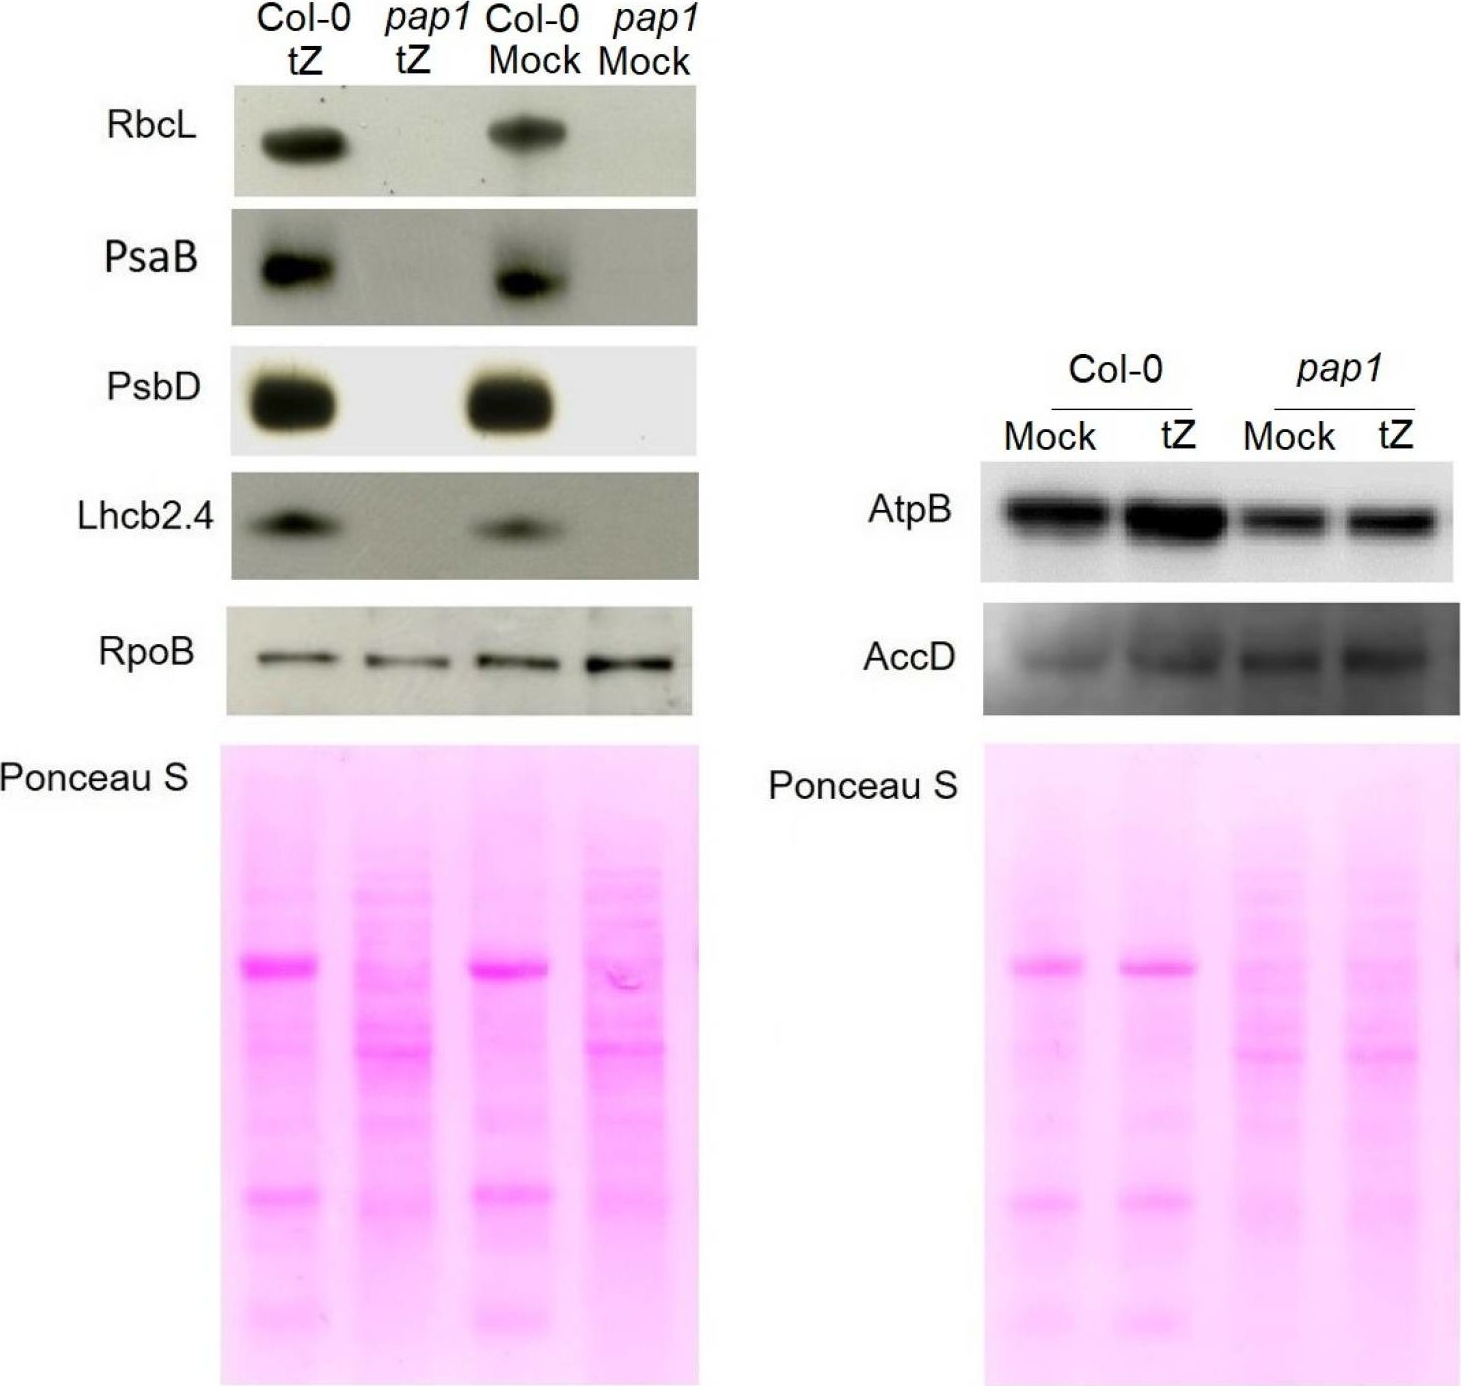
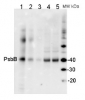
Open PublicationImmunoblot analysis of the photosynthetic proteins on the basis of equal total Ponceau S dye stained blot with proteins from leaves of wild type plants and pap1 mutant grown on MS medium in Petri dishes for four weeks under a 16 h light/8 h dark photoperiod at 23 °C with 100 ?E m?2 s?1. Proteins were visualized by immunoblotting using antibodies specific for RbcL, PsaB, PsbD, AtpB, RpoB, AccD and Lhcb2.4 proteins.
Reactant: Arabidopsis thaliana (Thale cress)
Application: Western Blotting
Pudmed ID: 33629953
Journal: Elife
Figure Number: 6A
Published Date: 2021-02-25
First Author: Pipitone, R., Eicke, S., et al.
Impact Factor: 7.448
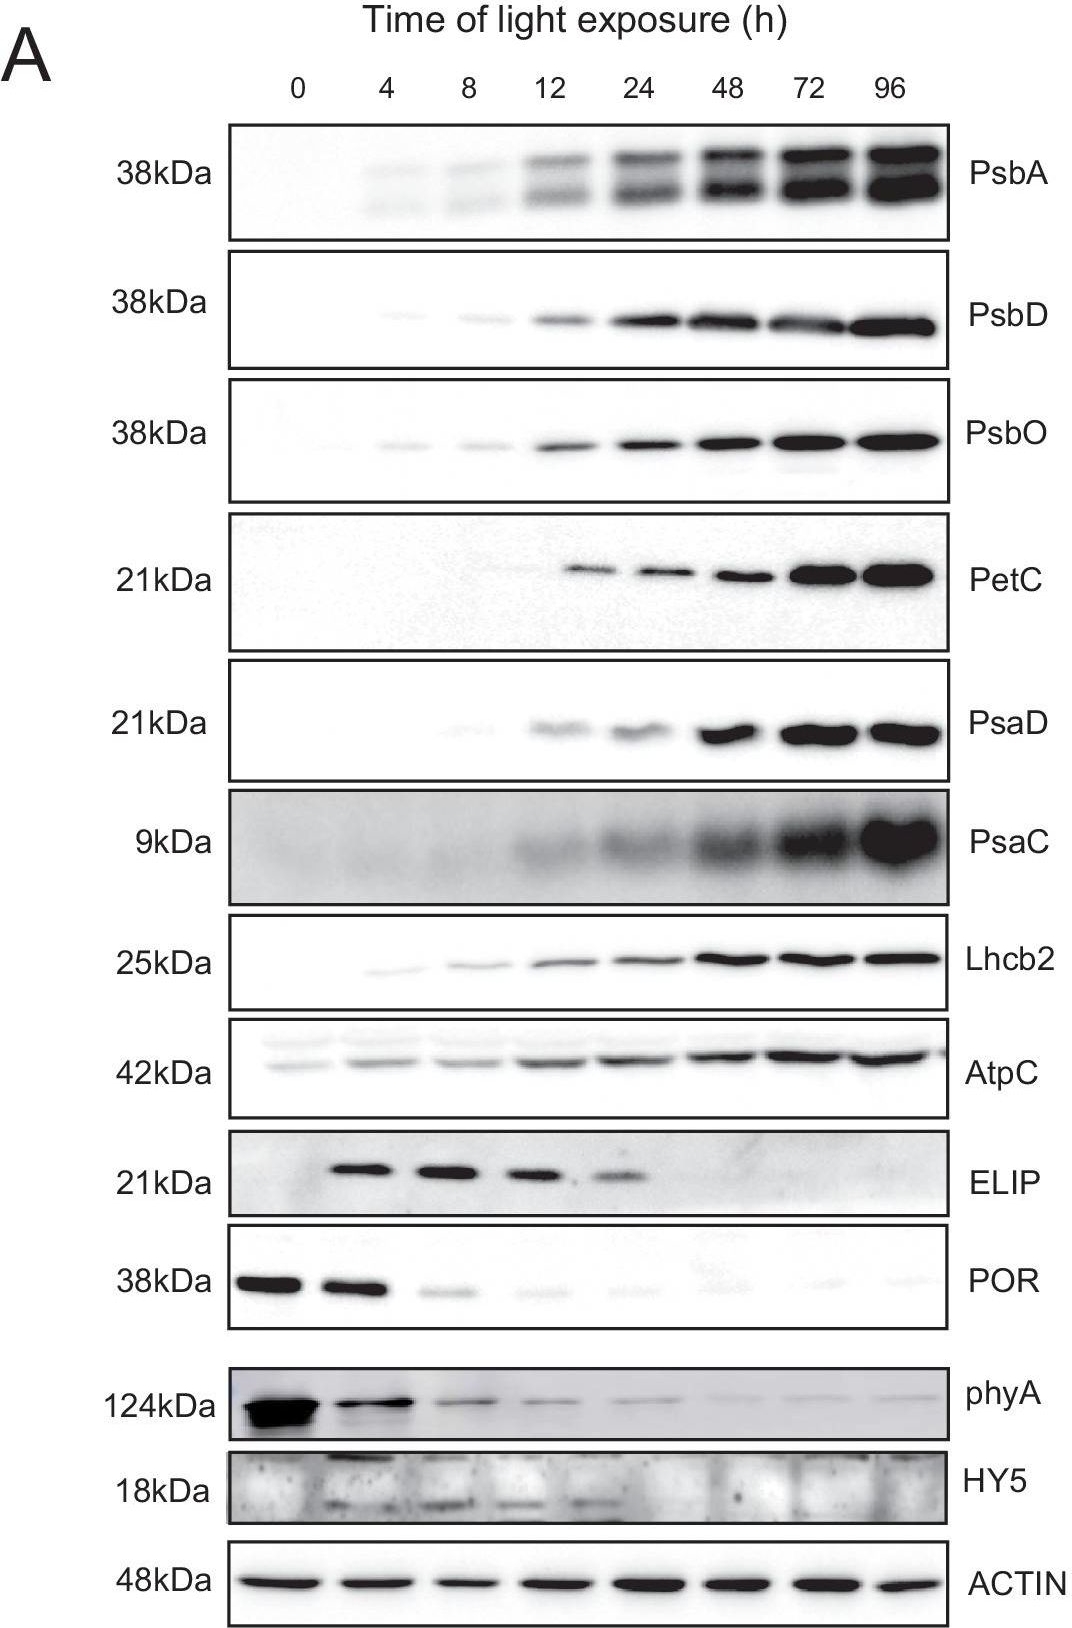
Open PublicationAccumulation dynamics of photosynthesis-related proteins during de-etiolation.Three-day-old etiolated seedlings of Arabidopsis thaliana were illuminated for 0 hr (T0), 4 hr (T4), 8 hr (T8), 12 hr (T12), 24 hr (T24), 48 hr (T48), 72 hr (T72), and 96 hr (T96) under white light (40 µmol/m2/s). (A) Proteins were separated by SDS-PAGE and transferred onto nitrocellulose membrane and immunodetected with antibodies against PsbA, PsbD, PsbO, PetC, PsaD, PsaC, Lhcb2, AtpC, ELIP, POR, phyA, HY5, and ACTIN proteins. (B–C) Quantification of PsbA, PetC, and PsaC during de-etiolation. Heatmap (B) was generated after normalization of the amount of each protein relative to the last time point (T96). Graph (C) corresponds to the absolute quantification of proteins at T96. Error bars indicate ± SD (n = 3). Quantification of photosystem-related proteins during de-etiolation is detailed in Figure 6—figure supplement 1.Figure 6—source data 1.Quantitative data for immunoblot analysis.Quantitative data for immunoblot analysis.Quantification of photosynthesis-related proteins.(A) Immunodetection of PsbA, PetC, and PsaC during de-etiolation. Dilutions were used for the later time points to avoid saturation of the signal. (B) Different bands were detected by Amersham Imager program and quantified by Image QuantTL (Amersham). (C) Calibration curves were created using recombinant proteins (Agrisera). Calibration curve composition: PsbA 10 ng (A; lane a), 5 ng (b), 2.5 ng (c), and 1.25 ng (d); PetC 10 ng (e), 5 ng (f), 2.5 ng (g), and 1.25 ng (h); PsaC 3 ng (i), 1.5 ng (l), 0.75 ng (m), and 0.325 ng (n). Data indicate mean ± SD (n = 3–4). Raw data and calculations are shown in Figure 6—source data 1.
- Additional Information
-
Additional information: The peptide used to elicit this antibody has a perfect conservation across all full-length PsbD sequences from higher plants, lower plants, cyanobacteria and unicellular algae except: minor substitutions in some Prochlorococcus & Dinoflagellate sequences, The antibody should still work against these taxa, but it has not been tested yet, This antibody does not detect PsbA protein (D1),This product can be sold containing ProClin if requested Additional information (application): There is a confirmed cross-reaction with TLA1 protein in Chlamydomonas reinhardtii.
For samples with a very low PSII content theremight be detection problems independent of the antibody. PSII proteins can vary in level depending upon liquid culture conditions. When the cells are in a stationary phase PSII content can drop to a very low level.
- Background
-
Background: D2 protein (PsbD) forms the reaction core of PSII (Photosystem II) as a heterodimer with the D1 protein (PsbA). PsbD is homologous to the D1 protein, with slightly higher molecular mass of about 39.5 kDa. Accumulation of D2 protein is an important step in the assemply of the PSII reaction centre complex.
- Product Citations
-
Selected references: Li et al. (2025). Salicylic acid and ROS signaling modulate hypocotyl elongation in darkness via NPR1 and EX1. Sci Adv. 2025 Oct 31;11(44):eadx4417. doi: 10.1126/sciadv.adx4417.
Zhong et al. (2025). Met246 and Asn250 in the D2 Protein are Essential for the Operation of the Quinone-Fe-Acceptor Complex of Photosystem II. Plant Cell Physiol. 2025 Jul 14:pcaf078. doi: 10.1093/pcp/pcaf078.
Lang et al. (2025). Complexome profiling of the Chlamydomonas psb28 mutant reveals TEF5 as an early photosystem II assembly factor. Plant Cell. 2025 Jun 4;37(6):koaf055. doi: 10.1093/plcell/koaf055.
Krupinska et al. (2025). Iron allocation to chloroplast proteins depends on the DNA-binding protein WHIRLY1. Planta. 2025 Jun 17;262(2):32. doi: 10.1007/s00425-025-04736-8. McKenzie and Puthiyaveetil (2025). Protein phosphorylation and oxidative protein modification promote plant photosystem II disassembly for repair. Plant Commun . 2025 Mar 10;6(3):101202. doi: 10.1016/j.xplc.2024.101202.
Zhao et al. (2024). Psb28 protein is indispensable for stable accumulation of PSII core complexes in Arabidopsis.Plant J. 2024 May 26. doi: 10.1111/tpj.16844.
Ciesielska et al. (2024). S2P2-the chloroplast-located intramembrane protease and its impact on the stoichiometry and functioning of the photosynthetic apparatus of A. thaliana. Front Plant Sci. 2024 Mar 15:15:1372318. doi: 10.3389/fpls.2024.1372318.
Khaig and Eaton-Rye (2023). Lys264 of the D2 Protein Performs a Dual Role in Photosystem II Modifying Assembly and Electron Transfer through the Quinone–Iron Acceptor Complex. Biochemistry 2023, 62, 18, 2738–2750
Jiang et al. (2023). Toxic effects of lanthanum (III) on photosynthetic performance of rice seedlings: Combined chlorophyll fluorescence, chloroplast structure and thylakoid membrane protein assessment. Ecotoxicol Environ Saf. 2023 Nov 15:267:115627.doi: 10.1016/j.ecoenv.2023.115627.
Rredhi et al. (2023). The UV-A Receptor CRY-DASH1 Up- and Downregulates Proteins Involved in Different Plastidial Pathways. J Mol Biol. 2023 Sep 10:168271.doi: 10.1016/j.jmb.2023.168271.
Wu et al (2023) Disruption of LEAF LESION MIMIC 4 affects ABA synthesis and ROS accumulation in rice
Cao et al. (2023). An unexpected hydratase synthesizes the green light--absorbing pigment fucoxanthin
Jin et al. (2023) Dual roles for CND1 in maintenance of nuclear and chloroplast genome stability in plants. Cell Rep. 2023 Mar 28;42(3):112268. doi: 10.1016/j.celrep.2023.112268. Epub 2023 Mar 17.
Cano-Ramirez et al. (2023) Low-temperature and circadian signals are integrated by the sigma factor SIG5. Nat Plants. 2023 Apr;9(4):661-672. doi: 10.1038/s41477-023-01377-1. Epub 2023 Mar 30.
Calderon et al. (2023) Rubredoxin 1 promotes the proper folding of D1 and is not required for heme b559 assembly in Chlamydomonas photosystem II, Journal of Biological Chemistry, 2023, 102968, ISSN 0021-9258.
von Bismarck, et al (2023). Light acclimation interacts with thylakoid ion transport to govern the dynamics of photosynthesis in Arabidopsis. New Phytol. 2023;237(1):160-176. doi:10.1111/nph.18535
Maeda et al. (2022). Characterization of photosystem II assembly complexes containing ONE-HELIX PROTEIN1 in Arabidopsis thaliana. J Plant Res. 2022 Mar;135(2):361-376. doi: 10.1007/s10265-022-01376-x. Epub 2022 Feb 10. PMID: 35146632.(CN-PAGE)
Joo et al. (2022) Sex-linked deubiquitinase establishes uniparental transmission of chloroplast DNA. Nat Commun. 2022 Mar 3;13(1):1133. doi: 10.1038/s41467-022-28807-6. PMID: 35241655; PMCID: PMC8894339.
Xiong et al. (2022) a chloroplast nucleoid protein of bacterial origin linking chloroplast transcriptional and translational machineries, is required for proper chloroplast gene expression in Arabidopsis thaliana. Nucleic Acids Res. 2022 Jun 23;50(12):6715–34. doi: 10.1093/nar/gkac501. Epub ahead of print. PMID: 35736138; PMCID: PMC9262611.
Zang, Xu, Yan & Wu (2022). Elevated CO2 modulates the physiological responses of Thalassiosira pseudonana to ultraviolet radiation [published online ahead of print, 2022 Sep 22]. J Photochem Photobiol B. 2022;236:112572. doi:10.1016/j.jphotobiol.2022.112573
Burlacot et al. (2022) Alternative photosynthesis pathways drive the algal CO2-concentrating mechanism. Nature 605, 366–371 (2022). https://doi.org/10.1038/s41586-022-04662-9
Bychkov et al. (2022) The role of PAP4/FSD3 and PAP9/FSD2 in heat stress responses of chloroplast genes. Plant Sci. 2022 Sep;322:111359. doi: 10.1016/j.plantsci.2022.111359. Epub 2022 Jun 20. PMID: 35738478.
Mazur et al. (2021) The SnRK2.10 kinase mitigates the adverse effects of salinity by protecting photosynthetic machinery. Plant Physiol. 2021 Dec 4;187(4):2785-2802. doi: 10.1093/plphys/kiab438. PMID: 34632500; PMCID: PMC8644180.
von Bismarck et al. (2021) Light acclimation interacts with thylakoid ion transport to govern the dynamics of photosynthesis. Research Square; 2021. DOI: 10.21203/rs.3.rs-948381/v1.
Cecchin et al (2021) LPA2 protein is involved in photosystem II assembly in Chlamydomonas reinhardtii. Plant J. 2021 Jul 4. doi: 10.1111/tpj.15405. Epub ahead of print. PMID: 34218480.
Chen, Liu & Liu (2021) Loss-Function of EGY1 Results in Photosynthesis Damage through Reducing Stability of Photosystem II in Arabidopsis thaliana. Russ J Plant Physiol (2021).
Li et al. (2021). Physiological responses of Skeletonema costatum to the interactions of seawater acidification and the combination of photoperiod and temperature. Biogeosciences, 18, 1439–1449, 2021.
Pipitone et al. (2021). A multifaceted analysis reveals two distinct phases of chloroplast biogenesis during de-etiolation in Arabidopsis. Elife. 2021 Feb 25;10:e62709. doi: 10.7554/eLife.62709. PMID: 33629953; PMCID: PMC7906606.
Amstutz et al. (2020). An atypical short-chain dehydrogenase–reductase functions in the relaxation of photoprotective qH in Arabidopsis. Nat Plants , 6 (2), 154-166
Wang et al. (2020) Rerouting of ribosomal proteins into splicing in plant organelles. BioRxiv, DOI: 10.1101/2020.03.03.974766 . BN-PAGE
Swift et al. (2020). Functional Analysis of PSRP1, the Chloroplast Homolog of a Cyanobacterial Ribosome Hibernation Factor. Plants (Basel). 2020 Feb 6;9(2). pii: E209. doi: 10.3390/plants9020209.
Koh et al. (2019). Heterologous synthesis of chlorophyll b in Nannochloropsis salina enhances growth and lipid production by increasing photosynthetic efficiency. Biotechnol Biofuels. 2019 May 14;12:122. doi: 10.1186/s13068-019-1462-3. eCollection 2019.
Pralon et al. (2019). Plastoquinone homoeostasis by Arabidopsis proton gradient regulation 6 is essential for photosynthetic efficiency. Commun Biol. 2019 Jun 20;2:220. doi: 10.1038/s42003-019-0477-4.
Dogra et al. (2019). Oxidative post-translational modification of EXECUTER1 is required for singlet oxygen sensing in plastids. Nat Commun. 2019 Jun 27;10(1):2834. doi: 10.1038/s41467-019-10760-6.
Kumar et al. (2019). Organic radical imaging in plants: Focus on protein radicals. Free Radic Biol Med. 2019 Jan;130:568-575. doi: 10.1016/j.freeradbiomed.2018.10.428.
Lv et al. (2019). Uncoupled Expression of Nuclear and Plastid Photosynthesis-Associated Genes Contributes to Cell Death in a Lesion Mimic Mutant. Plant Cell. 2019 Jan;31(1):210-230. doi: 10.1105/tpc.18.00813.
Roth et al. (2019). Regulation of Oxygenic Photosynthesis during Trophic Transitions in the Green Alga Chromochloris zofingiensis. Plant Cell. 2019 Feb 20. pii: tpc.00742.2018. doi: 10.1105/tpc.18.00742.
Krupinska et al. (2019). The nucleoid-associated protein WHIRLY1 is required for the coordinate assembly of plastid and nucleus-encoded proteins during chloroplast development. Planta. 2019 Jan 11. doi: 10.1007/s00425-018-03085-z.
Chen et al. (2018). Mg-dechelatase is involved in the formation of photosystem II but not in chlorophyll degradation in Chlamydomonas reinhardtii. Plant J. 2018 Nov 24. doi: 10.1111/tpj.14174.
Mao at al. (2018). Comparison on Photosynthesis and Antioxidant Defense Systems in Wheat with Different Ploidy Levels and Octoploid Triticale. Int J Mol Sci. 2018 Oct 2;19(10). pii: E3006. doi: 10.3390/ijms19103006.
Partensky et al. (2018). Comparison of photosynthetic performances of marine picocyanobacteria with different configurations of the oxygen-evolving complex. Photosynth Res. 2018 Jun 25. doi: 10.1007/s11120-018-0539-3.
Danilova et al. (2018). Differential impact of heat stress on the expression of chloroplast-encoded genes. Plant Physiol Biochem. 2018 May 23;129:90-100. doi: 10.1016/j.plaphy.2018.05.023.
Myouga et al. (2018). Stable accumulation of photosystem II requires ONE-HELIX PROTEIN1 (OHP1) of the light harvesting-like family. Plant Physiol. 2018 Feb 1. pii: pp.01782.2017. doi: 10.1104/pp.17.01782.
Schottler et al. (2017). The plastid-encoded PsaI subunit stabilizes photosystem I during leaf senescence in tobacco. J Exp Bot. 2017 Feb 1;68(5):1137-1155. doi: 10.1093/jxb/erx009.
Kim et al. (2017). Effect of cell cycle arrest on intermediate metabolism in the marine diatom Phaeodactylum tricornutum. Proc Natl Acad Sci U S A. 2017 Sep 19;114(38):E8007-E8016. doi: 10.1073/pnas.1711642114.
Cantrell and Peers (2017). A mutant of Chlamydomonas without LHCSR maintains high rates of photosynthesis, but has reduced cell division rates in sinusoidal light conditions. PLoS One. 2017 Jun 23;12(6):e0179395. doi: 10.1371/journal.pone.0179395.
Gandini et al. (2017). The transporter SynPAM71 is located in the plasma membrane and thylakoids, and mediates manganese tolerance in Synechocystis PCC6803. New Phytol. 2017 Mar 20. doi: 10.1111/nph.14526.
Yang-Er Chen et al. (2017). Responses of photosystem II and antioxidative systems to high light and high temperature co-stress in wheat. J. of Exp. Botany, Volume 135, March 2017, Pages 45–55.
Yoshida et al. (2016). Hisabori T1.Two distinct redox cascades cooperatively regulate chloroplast functions and sustain plant viability. Proc Natl Acad Sci U S A. 2016 Jul 5;113(27):E3967-76. doi: 10.1073/pnas.1604101113. Epub 2016 Jun 22.
Mazur et al. (2016). Overlapping toxic effect of long term thallium exposure on white mustard (Sinapis alba L.) photosynthetic activity. Mazur et al. BMC Plant Biology (2016) 16:191.
Kowalewska et al. (2016). Three-dimensional visualization of the internal plastid membrane network during runner bean chloroplast biogenesis. Dynamic model of the tubular-lamellar transformation. The Plant Cell March 21, 2016 tpc.01053.2015. - Protocols
-
Agrisera Western Blot protocol and video tutorials
Protocols to work with plant and algal protein extracts
Oxygenic photosynthesis poster by prof. Govindjee and Dr. Shevela
Z-scheme of photosynthetic electron transport by prof. Govindjee and Dr. Björn and Dr. ShevelaQuantitative Immunoblotting in Plant Sciences using Global Antibodies
Amanda Cockshutt1 & Joanna Porankiewicz-Asplund2
1.Environmental Proteomics NB Inc. Sackville NB CANADA,
2.Agrisera AB, Vännäs, SWEDEN,Summary:
Detecting and quantitating important proteins in plants and other photosynthetic organisms has become more practical and powerful with the application of quantitative immunoblotting using global antibodies which recognize proteins evenly across a wide range of taxa. While many tools are commercially available for the examination of medically relevant proteins in mammals, such tools have been lacking for the study of pressing questions in other organisms. Here we present the advantages of quantitative immunoblotting and the methodology necessary to apply these tools.Introduction | The exquisite specificity of the antibody antigen interaction has long been exploited by protein biochemists. Antibodies bind to small regions on proteins, termed epitopes, which often consist of only a few amino acids. This binding is highly specific
and of high affinity. As each antibody recognizes only a small part of the whole protein, an immunogenic peptide can be selected using sequence alignments. This short peptide is highly conserved and exclusive to the protein under study. The resulting antibodies are then immunoreactive with the conserved peptide region within intact proteins derived from a number of species. We refer to these as Global Antibodies, and they provide both scientific and practical advantages. In non-medical areas such as plant sciences, comparative analyses across species, is often productive; Global Antibodies permit such cross-taxon studies with level detection efficiencies across wide taxonomic ranges. From a practical standpoint, a Global Antibody functioning across a wide taxonomic range reduces the cost of antibody production and stocking by creating a detection tool useful in a wide range of studies.
The ELISA, or Enzyme Linked ImmunoSorbent Assay, employs specific antibodies in a high through put application for the measurement of specific substances in samples of diverse origins. While some sample and antibody combinations can be optimized for detections using ELISA, others are less successful. This can be the result of antibodies with significant cross reactivities, samples that do not adhere optimally to the plate, a lack of quantitated standards or samples of variable quality that display differential reactivity in ELISA. A similar approach is the quantitative immunoblot. As such, it uses the same principles as the ELISA, a reliance on the highly specific antibody antigen interaction to measure the amount of a given protein in a complex mixture. The
major distinguishing feature of this method is the inclusion of a step to electrophoretically separate the proteins in the sample according to their molecular weights. Thus, all samples can be solubilized using a standardized procedure and analyzed concurrently for a number of interesting proteins. The separation step allows the researcher to be more confident that the signal generated actually results from the target protein in question because it is spatially resolved from cross-reactions which would confound an ELISA system.Limitations of Traditional Techniques | A number of traditional techniques are available for the measurement of different functions or complexes of photosynthetic organisms. These include an array of enzyme and functional assays. A disadvantage of such approaches is that they require individually specialized sample harvesting and preparation techniques, and often specialized equipment or reagents for each assay. Therefore a single sample preparation cannot be used to quantify different protein complexes. Furthermore, many samples are not available in the quantities or preservation states necessary for multiple determinations of different protein complexes.
Advantages of Immunodetections with Global Antibodies | When Global Antibodies are used for quantitative immunodetections even small, mixed samples from various harvesting procedures can be assessed for multiple complexes simultaneously. Since all detections employ a common solubilization protocol as a starting point, comparisons between complexes can be made with greater confidence. Since Global Antibodies recognize short highly conserved regions of the protein targets they can be applied to a very broad range of target organisms. They can also be applied with considerable confidence to uncharacterized or mixed samples.
Quantitated recombinant protein standards have been generated to be used as a calibration with Global Antibodies. The target peptide antigen is perfectly conserved in these standard proteins, thus they can be applied for comparative quantitation of the target protein from all species.
Standards and antibodies available
Photosystem I Anti-PsaC (AS04 042) | standard: recombinant PsaC(AS04 042S)
Photosystem II Anti-PsbA C-terminal (AS01 016, AS05 084) | Anti-PsbA N-terminal | (AS06 124) | standard: recombinant PsbA (AS01 016S) | Anti-PsbB (AS04 038) | Anti-PsbD (AS06 146) |
ATP Synthase Anti-AtpB (AS03 030, AS05 085) | standard: recombinant AtpB (AS03 030S) |
RuBisCO Anti-RbcL RbcL (AS01 017, AS03 037)| standard: Rubisco protein (AS03 017S)
Nitrogen Metabolism: Anti-GlnA (AS01 018) | standard: recombinant GlnA (AS01 018S) |
Anti-NifH (AS01 021A) | standard: recombinant NifH (AS01 021S)
Methodology | Sample Preparation. Plant samples are generally ground with liquid nitrogen in a mortar and pestle. The resulting powder is transferred to a plastic tube. Algal samples can be either concentrated by centrifugation or, preferably, by filtration onto glass fiber filters.
Solubilization is performed in Agrisera extraction buffer PEB (AS08 300) , 0.1mg/mL PefaBloc SC (AEBSF) protease inhibitor (Roche). Disruption is most optimally obtained through flash freezing of the sample in liquid nitrogen alternated with thawing by sonication with a microtip. This process can be repeated depending on the toughness of the sample. The sample is adjusted to 50 mM dithiothreitol and heated to 70°C for 5 minutes. Samples are cooled and centrifuged briefly prior to electrophoresis. Optimal quantitation is achieved using moderate sample loads per gel lane, generally 0.5 to 2.5 ug total protein, depending on the abundance of the target protein.
Electrophoresis and Immunoblotting: Once solubilized, the proteins can be separated electrophoretically in a number of systems. We obtain optimal results with the Invitrogen NuPAGE gel system using Bis-Tris 4-12% gradient gels. Proteins are separated in MES SDS running buffer according to the manufacturer’s recommendations at 200 V for 35 minutes. The gels are transferred to PVDF in the same apparatus, the SureLock XCell blot module, for 60 minutes at 30 V for a single gel or 80 minutes for a pair. Following transfer the blots are blocked in 2% blocking agent in tris buffered saline with 0.1% Tween 20 (TBS-T) for 1 hour at room temperature with gentle agitation. The blot is incubated with primary antibody, usually at 1:25 000 to 1:50 000 diluted in 2% blocking agent, for 1 hour at room temperature. For quantitation a relatively high primary antibody:target protein ratio gives more reliable results than immunoblots at low ratios of primary antibody:target protein.
The blot is washed extensively in TBS-T (twice briefly, once for 15 minutes and three times for five minutes). The blot is incubated with secondary antibody, for example goat anti-rabbit IgG horse radish peroxidase conjugated, at 1:50,000 in 2% blocking agent, for 1h/RT with agitation. The blot is washed as above and developed with chemiluminescence detection reagent in mid picogram or extreme femtogram range.Quantitation | When quantitated standards are included on the blot, the samples can be quantitated using the available software. We obtain excellent quantitation with images captured on the Bio-Rad Fluor-S-Max or equivalent instrument using Bio-Rad QuantityOne software. The contour tool is used to select the area for quantitation and the values are background subtracted to give an adjusted volume in counts for each standard and sample. Using this protocol allows us to generate linear standard curves over 1-1.5 orders of magnitude range in target load. It is important to note that immunodetections usually show a strongly sigmoidal signal to load response curve, with a region of trace detection of low loads, a pseudolinear range and a region of saturated response with high loads. For immunoquantitation it is critical that the target proteins in the samples and the standard curve fall within the pseudolinear range. Our total detection range using this protocol spans over 2 orders of magnitude, but the quantifiable range is narrower.
Example | Undergraduate students performed a light shift experiment on two cyanobacterial strains, Synechococcus elongatus PCC 7942 and Anabaena sp. PCC 7120. The students prepared 4 samples for each species and loaded 0.1 ug chlorophyll per lane. Standard lanes of PsbA (D1) protein contained 0.05 pmoles , 0.15 pmoles and 0.45 pmoles. The blots were processed as described above with the chicken anti-PsbA antibody used at 1:20,000 and rabbit anti-chicken IgY-HRP secondary antibodies at 1:50,000. The resulting blot is shown in Figure 1.
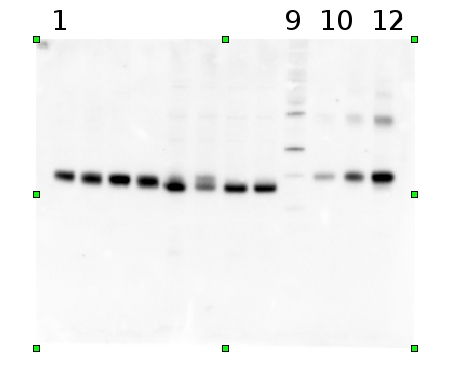
Figure 1: An example immunoblot of samples of Synechococcus elongatus PCC 7942 (lanes 1-4) and Anabaena sp. PCC 7120 (lanes 5-8). Molecular weight markers (MagicMark XP, Invitrogen) are in lane 9. Recombinant PsbA protein standards are loaded in lanes 10-12 at 0.05 pmoles, 0.15 pmoles and 0.45 pmoles.
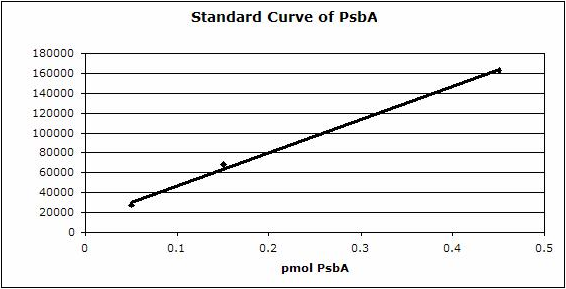
Figure 2: Standard curve for the blot in Figure 1. Picomoles of quantitated standard is plotted on the X-axis versus the adjusted signal volume obtained on the Y-axis.
Conclusion | Quantitative immunoblotting is a powerful but simple tool for the measurement of protein complexes from photosynthetic and other organisms. This technique can be applied to a wide range of species with excellent results, because Global Antibodies raised against conserved peptides can be shared across research on different species and research areas like: ecophysiology, microbial ecology, molecular physiology, proteomics and oceanography.
References | Bouchard J, Suzanne Roy S, Campbell DA (2006) Ultraviolet-B Effects on the Photosystem II-D1 Protein of Phytoplankton Species and Natural Phytoplankton Communities Photochemistry and Photobiology, 82: 936-951
Campbell DA, Cockshutt AM, Porankiewicz-Asplund J (2003) Analyzing Photosynthetic Complexes in Uncharacterized Species or Mixed Phytoplankton Communities using Global Antibodies. Physiologia Plantarum 119: 322-327
MacKenzie TDB, Johnson JM, Cockshutt AM, Burns RA, Campbell DA (2005) Large reallocations of carbon, nitrogen and photosynthetic reductant among phycobilisomes, photosystems and Rubisco during light acclimation in Synechococcus elongatus are constrained in cells under low environmental inorganic carbon. Archives of Microbiology, 183: 190 - 202
Recommended secondary antibodies: goat anti-rabbit HRP conjugated, goat anti-rabbit ALP conjugated
Recommended chemiluminescent detection reagent: AgriseraECLBright
Agrisera Western Blot protocol and video tutorialsQuestions? You are welcome to contact us.
- Reviews:
-
Auroy Pascaline | 2020-07-27This antibody has a very strong signal and specific signal around 30 kDa in C. reinhartii. The dilution of 1:10 000 works well probably with 1:20 000. I didn't test yet.Jun Liu | 2014-01-14This antibody is always very good and gave a specific and strong signal around 30 kDa in Arabidopsis. The dilution of 1:20 000 works well and can be reused for at least 3 times.
Related products
AS09 146S | Recombinant protein standard for quantitation and positive control, for use in Western blot.
AS09 602 | Clonality: Polyclonal | Host: Goat | Reactivity: Rabbit IgG (H&L)
AS05 084 | Clonality: Polyclonal | Host: Rabbit | Reactivity: [global antibody] for higher plants, algae, liverwort, cyanobacteria, diatoms | cellular [compartment marker] of thylakoid membrane
Benefits of using this antibody
AS11 1787 | Clonality: Polyclonal | Host: Rabbit | Reactivity: A. thaliana, C.reinhardtii, C. zofingiensis, E. crus-galli, H. vulgare, O. sativa, P. ginseng, P. patens, P. sativum, P. vulgaris, P. yezoensis, Synochococcus sp. PCC7002, Synechocystis sp. PCC6803, T. aestivum, Triticale, Z. mays, V. lychnitis, V. radiate
AS04 038 | Clonality: Polyclonal | Host: Rabbit | Reactivity: [global antibody] for higher plants, Physcomitrella patens, algae, cyanobacteria, diatoms
Benefits of using this antibody
AS06 112 | Clonality: Polyclonal | Host: Rabbit | Reactivity: A.thaliana, H. vulgare, N.tabacum, O. sativa, S. oleracea | cellular [compartment marker] of thylakoid membrane
AS06 113 | Clonality: Polyclonal | Host: Rabbit | Reactivity: A.thaliana, P.sativum, T. aestivum
AS05 092 | Clonality: Polyclonal | Host: Rabbit | Reactivity: A. thaliana, H. vulgare, N. tabacum, P. sativum, Z. mays